Acknowledgements
Acknowledgements and Dedication
A project of this size is never a one-person job and I would like to thank Ken Ritchie, Amy Rodger and Martin Steven in particular for their constant help, guidance and support. Alasdair Stuart contributed magnificently to the sections on the results council-by-council and equalities. Other colleagues have assisted with the text and gathering data, including Christine McCartney, Gertrud Malmersjo and Hywel Nelson. I would also like to thank members of the ERS who contributed thoughts, including our Chair, Colin Rosenstiel. Errors and omissions are my own responsibility, and although the report is broadly in line with ERS policy, interpretations and expressions of opinion are also my own.
Thank you also to the officers who work in the elections and information departments of Scotland’s local authorities who have provided data, and to several councillors of various parties who have contributed their insights.
Particular credit is due to the Fairshare campaign, notably James Gilmour, Andrew Burns, Rob Munn, Ian Baxter, Willie Sullivan, Ken (again), Amy (again) and Ross Martin, not only for their help in writing the report but for making it all possible in the first place. I would like to dedicate this report collectively to Fairshare’s campaigners.
Lewis Baston
Director of Research Electoral Reform Society November 2007
Introduction
Introduction
The Scottish local elections on 3 May 2007 were the first major use of the Single Transferable Vote (STV) system in a public election in Great Britain. The introduction of STV followed decades of campaigning by electoral reformers and, particularly after the establishment of the Scottish Parliament in 1999, was the subject of many consultations and often heated debates among Scotland’s politicians and parties. While the eventual decision to use STV for council elections might have appeared as a pragmatic deal between coalition partners in the Scottish Parliament, pro-STV campaigners always argued that STV was needed to give Scotland a better democracy with more representative institutions.
STV was not entirely new. Scotland had used it to elect its Education Boards in the 1920s, but these boards did not have the range of powers of modern local authorities, and although ‘university’ seats at Westminster were elected by STV in the first half of the last century, there were only 12 of them. The Republic of Ireland has used STV for all of its elections and the system has been re-introduced to Northern Ireland for all elections except those for Westminster, but the different political contexts in Ireland, both north and south, meant that the use of STV would be a very different proposition when transferred to mainland Britain.
These elections were therefore of much greater significance than the normal four-yearly battle for council seats. Politically, they have resulted in a dramatic redistribution of power between the parties in Scottish local government. They have ended the undeserved majorities that have given some party groups control with little effective opposition, rescued others from undeserved impotence and, in most local authorities, they have required parties to come together to form administrations. Most votes did something to get someone elected, and most voters now have councillor of their choice. In terms of election administration, these elections saw a number of innovations, both in voter education campaigns and in vote-counting technology.
But the most significant aspect of the elections is what they may mean for the future. Many regard STV – a proportional system which at the same time allows voters to choose and rank candidates – as being the connoisseur’s choice of electoral system and wish to see it used in all UK elections. It has already been recommended for Welsh local government by the Sunderland Commission, while the Arbuthnott and Richard Commissions have raised it as a possibility for the Scottish Parliament and Welsh Assembly. But, in spite of STV’s apparent growing popularity, the system nevertheless has its opponents: there are those who have argued, for example, that it is too complicated, that it will dilute the nature of local representation, that it will reduce the decision-taking effectiveness of local councils. To what extent do the Scottish local election results support the claims made by proponents of STV, and to what extent do they justify the concerns of its critics? The answers to these questions may influence the direction and pace of electoral reform in the UK and it is therefore such questions that we address in this report.
STV is a more sophisticated system than FirstPast-The-Post (FPTP). Analysis of the results therefore allows a more sophisticated approach that can provide us with a fuller picture of how voters view the parties. As these were the first STV elections, however, as well as looking at party fortunes we have also examined the extent to which voters were able to use the system effectively, and in looking at the results we have needed to disentangle changesresulting from the change in system from those arising from swings in party support.
Our analysis is extensive, but our conclusions are clear:
- STV has produced much more representative councils than would have been elected under the former First-Past-The-Post system;
- parties appear to have adapted well to the new system, although we expect that parties will develop their techniques as they gain experience of STV campaigning;
- voter understanding of the system appears to have been generally good, with a relatively low level of spoilt ballot papers (unlike the Scottish Parliament election held on the same day);
- most votes mattered, in the sense that they contributed to the election of a councillor.
Summary
Part1: What happened in the elections?
The report begins by looking at the outcomes of Scotland’s local elections in May 2007 and considers the effect of the Single Transferable Vote (STV) system, used for the first time in those elections.
The first chapter discusses the results. With the change to a new, proportional voting system, significant changes in the pattern of representation across Scotland’s councils might have been expected, and this was indeed what we saw. Prior to the elections, Labour was the strongest party in Scottish local government but its position was far from dominant – it only controlled 13 of the 32 councils and there were almost as many councils in which no single party or group had overall control. In 2007, Labour was the only party to win outright control of any councils, winning Glasgow and North Lanarkshire, while Independents control three further councils. However, the norm (27 out of 32 councils) is now no overall control (NOC) and a varied pattern of coalitions has emerged.
However, in looking at the changed fortunes of the parties, it is important to separate out two effects – that of the change in voting system and shifts in party support. We have done this by looking at what the 2003 elections might have produced if STV had been used then. This shows that while there was a marked swing in support from Labour to the Scottish National Party (SNP) in the May elections, the introduction of STV also had a pronounced effect, with parties losing seats which they had held through the distortions of the First-PastThe-Post (FPTP) system and also gaining seats that the unfairness of FPTP had denied them.
Councils across Scotland are now much more representative of the views of their voters. No longer are there councils where parties have majorities that cannot be justified by electoral support; where parties with significant support have no, or few, seats; or where the largest parties in terms of seats are not those with most votes. Measures of disproportionality show a marked improvement over the pre2007 situation. If the elections had a clear winner, it was the voters who got what they wanted.
Chapter 2 examines the results from the perspectives of the political parties. The Conservatives used the opportunity presented by the new system to put up nearly a full slate of candidates in mainland Scotland, including candidates in many areas where the Conservatives had not previously contested elections. Their chances would have been greater had their national popularity stood a bit higher, and if they had managed to obtain more transferred votes from supporters of other candidates. Labour had a bad election, but it was not without its brighter spots, including full control of two councils and more council leaders than any other party. The bulk of Labour voters tended to transfer preferences to other Labour candidates, meaning that fears of split votes turned out to have little justification. If Labour’s vote recovers from its low point in 2007, the party could win back a significant number of councils.
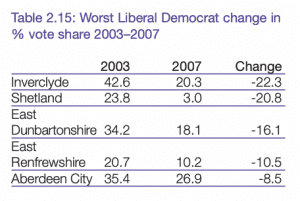
The Liberal Democrats, having campaigned for STV in local elections, had a disappointing overall result, with gains in some areas such as Highland being matched by defeats in previous strongholds like Inverclyde. They were relatively successful at attracting transfers from other parties, but this leaves them vulnerable to any future loss of support.
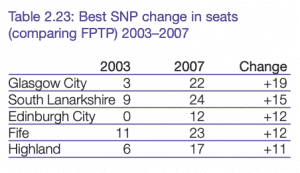
The SNP had a successful election in local government as well as Holyrood, becoming – narrowly – the largest party in Scottish local government. They polled reasonably well everywhere and are represented on more local authorities than any other party. Their councillor numbers rose steeply in central Scotland and Glasgow as their long-established vote was at last rewarded with seats, although they could have done even better had they put up more candidates.
The Green Party won representation in Edinburgh and Glasgow, amounting to eight councillors in all, and were successful in attracting transfers. They were more successful than the rival socialist parties, which won a seat each and paid the price for the SSP/ Solidarity split. The role of Independent candidates also changed, with a decline in established areas like Highland where the parties started to offer candidates, but some growth in hitherto partydominated areas like Ayrshire
The change from FPTP in single-member wards to STV in wards of three and four members presented the parties with new circumstances: how they responded is examined in Chapter 3. Parties clearly wanted to nominate at least as many candidates as the number of seats they could reasonably hope to win, but nominating too many candidates could risk ‘leakage’, i.e. the transfer of surplus votes from their candidates to those of other parties.
Labour nominated two or more candidates in just over half of the wards – as a result 76 per cent of their candidates were members of teams of candidates. The SNP, whose support is more evenly spread across the country, only nominated more than a single candidate in just over a quarter of all wards, resulting in most of their candidates campaigning on their own. With other parties, the nomination of more than one candidate in a ward was relatively rare.
It appears that the SNP might have suffered in several wards by nominating too few candidates – with their level of support, which might not have been anticipated in all cases, it is probable that more candidates could have won them additional seats. Although in one ward Labour may have lost a seat through over-nominating, its strategy appears to have been effective.
Proportional voting systems are more likely to produce results that reflect not only the spread of political opinion but also social diversity. With systems that require parties to nominate a team of candidates rather than just one person, parties will have an incentive to nominate members who can appeal to all parts of society, thereby increasing the numbers of candidates from under-represented groups, such as women, young people and people from ethnic minorities. Chapter 4 examines whether the introduction of STV increased the diversity of those elected.
The analysis shows that little has changed as a result of the 2007 election. This, however, was not an unsatisfactory outcome as, prior to the election, there were fears that women, particularly in Labour, would suffer from the transition to the new system. With the move to three- and four-member wards, the number of candidates that the major parties would nominate would fall, and there was concern that women would lose out to male councillors with many years of service. Within all four major parties, the percentage of candidates who were women dropped in 2007, but while in 2003 many women may have fought in unwinnable seats, in 2007, with a system that makes the concept of ‘safe’ seats less valid, the success rate of women was comparable to that of men. As a result, the number of women councillors remained more or less the same – an outcome that should provide some optimism for progress in subsequent STV elections.
More young people were elected in 2007, and in particular there were three who benefited from the legislative change reducing the minimum age for candidates to 18. The number of black, minority and ethnic (BME) councillors remained unchanged.
Part 2: The voters’ experience
Chapter 5 describes how STV offered voters a more sophisticated choice in that they were able to rank candidates rather than just marking one with a cross. Moreover, because votes were transferable, voters were able to vote for the candidates they wanted without needing to worry about whether their votes would be wasted.
However, voters also had a much wider choice. The average number of candidates per ward rose from 3.4 in 2003 to 7.4. In the larger towns the major parties were able to put up candidates in most wards – a change from previous elections, in which there were many wards for which parties either could not find candidates or did not consider it worth putting up candidates. In Glasgow and Edinburgh the average number of candidates per ward rose above 9.
There were no uncontested seats in 2007, whereas in 2003, 61 councillors were ‘elected’ unopposed.
There were a few tightly fought wards in which the number of candidates was only slightly greater than the number of seats, making the outcome of the election more predictable, but the numbers did not compare with the high proportion of seats safe for one party or another in previous elections.
A very high percentage of voters ended up with a councillor for whom they had voted. In 2003 about half of all voters voted for losing candidates, but in 2007 nearly three-quarters found the candidate to whom they had given their first preference had been successful. To this total must be added those who voted for an unsuccessful candidate with their first preference but for a winner with a second or subsequent preference. Consequently, a large majority of voters have a councillor of their choice. This can only strengthen the link between councillors and their constituents.
For most voters, the 2007 election would have been their first experience of transferable voting. Consequently there were concerns that voters used to voting with a single cross, and in many cases being urged by parties to vote with just a ‘1’, would not take advantage of the extended choice offered by STV. The results for a first STV election were, however, remarkable.
Chapter 6 looks at the evidence from those local authorities that published information on voters’ preferences. It shows that the median voter cast three preferences. As there were very few cases in which a party nominated three candidates, this demonstrates that most voters gave support to candidates of at least two parties. The average number of preferences expressed in four-seat wards was higher than in those with only three seats, possibly a consequence of parties making more multiple nominations in the four-seat wards. Around one voter in five expressed only a single preference: this group will include those who failed to appreciate the change in system and used only a cross (deemed to be a valid first preference) and the numbers voting for only one candidate can be expected to decline in future elections.
Although, in the majority of cases, the three candidates who were ahead in three-member wards in terms of first preferences, and the four top candidates in four-member wards, ended up as winners, in 20.7 per cent of wards there was one candidate who leapfrogged over another with the help of transfers to win a seat, and in 29 of the 32 local authorities there was at least one case of a candidate overtaking another to win. Transfers were therefore important to the results of many wards.
The local elections were held at the same time as the Scottish Parliament elections, following which the main media story – other than the success of the SNP – was the unacceptably high number of rejected ballot papers. However, Chapter 7 shows that across Scotland the rate of spoilt papers in the local government elections was very much lower than for the parliamentary election. While 1.85 per cent of local government ballots were spoilt, 4.07 per cent of the ballots for constituency candidates and 2.88 per cent for regional lists were spoilt in the parliamentary election
While any spoilt ballots are a cause for concern, the level in the local elections must be placed in perspective. More valid votes were cast than in the local elections of 2003, in spite of a new system being introduced for the first time requiring voting with numbers rather than a cross, and that was introduced alongside an existing X-voting system to which voters were accustomed. It therefore appears that, in general, voters did not have problems in adapting to STV.
Part 3: Election issues
This third part of the report considers some issues in the design of the election. Candidates were, as in previous elections, listed in alphabetical order and there is evidence that where parties nominated more than one candidate, the candidate placed higher on the ballot paper was advantaged over his or her running mates. Chapter 8 considers different options for ordering the ballot paper – random order, forms of rotation and the grouping of candidates by party – and proposes that these alternatives should be examined and, if appropriate, rigorously tested, before the next local government elections.
Chapter 9 considers the effects of the decision to divide Scotland into wards of three and four members for the implementation of STV. Although many argued for a wider range of ward sizes to make it easier to draw ward boundaries around what might be considered natural communities, there would appear to be only a very few cases in which boundaries seem to be clearly ‘unnatural’.
In total, there are 190 three-member wards and 163 with four members – as a consequence 53 per cent of councillors are in four-member wards. The mix of three- and four-member wards in different local authorities has been a consequence of the desire to create wards based on areas with defining characteristics – for example, there are urban areas where threemember wards are the norm and rural areas where four-member wards are common.
Larger ward sizes will give better protection against very disproportional results, but it remains the case that the ward sizes used produced a hugely more proportional result than would have been the case with the former First-Past-The-Post system, and it appears that the benefits of a move from 3- or 4- to 5- or 6-member wards would be slight.
In four-member wards, voters had a slightly wider choice of candidates than in threemember wards (8.16 to 6.68 on average). In four-member wards there was more chance of a major party putting up more than one candidate, thereby extending choice for party supporters. All but one of the minor party candidates (as opposed to Independents) were elected from four-member wards.
Part 4: Looking ahead
The final chapter concludes that the introduction of STV for Scotland’s local elections has been a success in that it has produced more representative councils, allowed voters to express their views on who they want to represent them in a more sophisticated way, and given most voters a councillor of their choice.
There is every reason to believe that future STV elections will build on this success. If, as appears likely, the local government elections are decoupled from those for the Scottish Parliament, voter information can be more focused on the use of transferable voting and election campaigns more focused on local issues. Now that the transition to STV has been made, we can hope to progress further towards councils that reflect the diversity of society and not just in terms of party support (although improvements will depend on parties’ approaches to candidate selection). The imperfections, albeit minor, in the alphabetical ordering of the ballot paper can surely be overcome before the next round of elections.
What remains to be seen now is how STV will, beyond elections, make democracy work better – how it will affect the way that councillors work and councils operate, and how it will change the way that electors and communities on the one hand and their elected representatives on the other relate. The Electoral Reform Society advocated STV not just to make electoral outcomes fairer, but because it believed that STV can, over time, change the way we conduct our politics, and these are issues that the Society will now be examining.
This report focuses on the 2007 elections for Scotland’s councils. The success of these elections points to the case for extending the use of STV to the parliamentary elections, and indeed to all elections in Scotland.
Part 1: What happened in the elections?
Chapter 1: Who won the council elections?
The 2007 STV elections produced 27 councils under no overall control. The exceptions were the three Independent Island authorities, plus Glasgow and North Lanarkshire where Labour retained a majority. Labour also won exactly half the seats in Midlothian and while this is technically no overall control, Labour has been able to form an administration with an effective majority on the casting vote. No other party achieved a majority anywhere.
Councillors elected: the facts
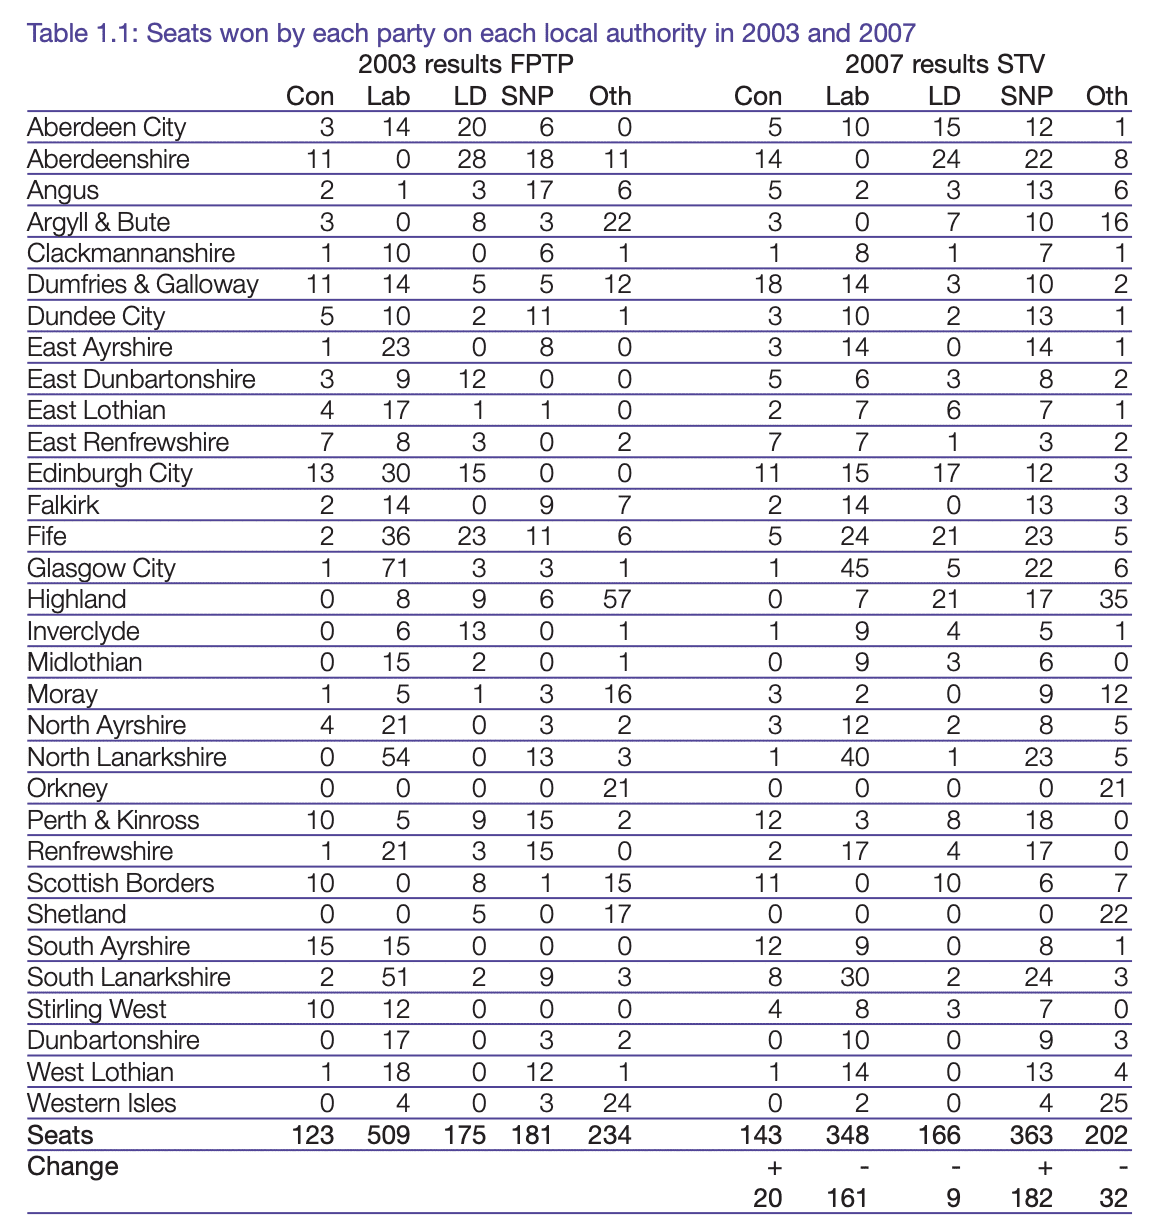
Compared to the FPTP result in 2003, therefore, the SNP made strong national net gains, very much at Labour’s expense. The Conservatives also advanced a little, and Independents and the Liberal Democrats slipped back. However, the contrast between these results conflates two separate sources of change – the new electoral system itself, and changes in what voters chose to do in 2003 and 2007.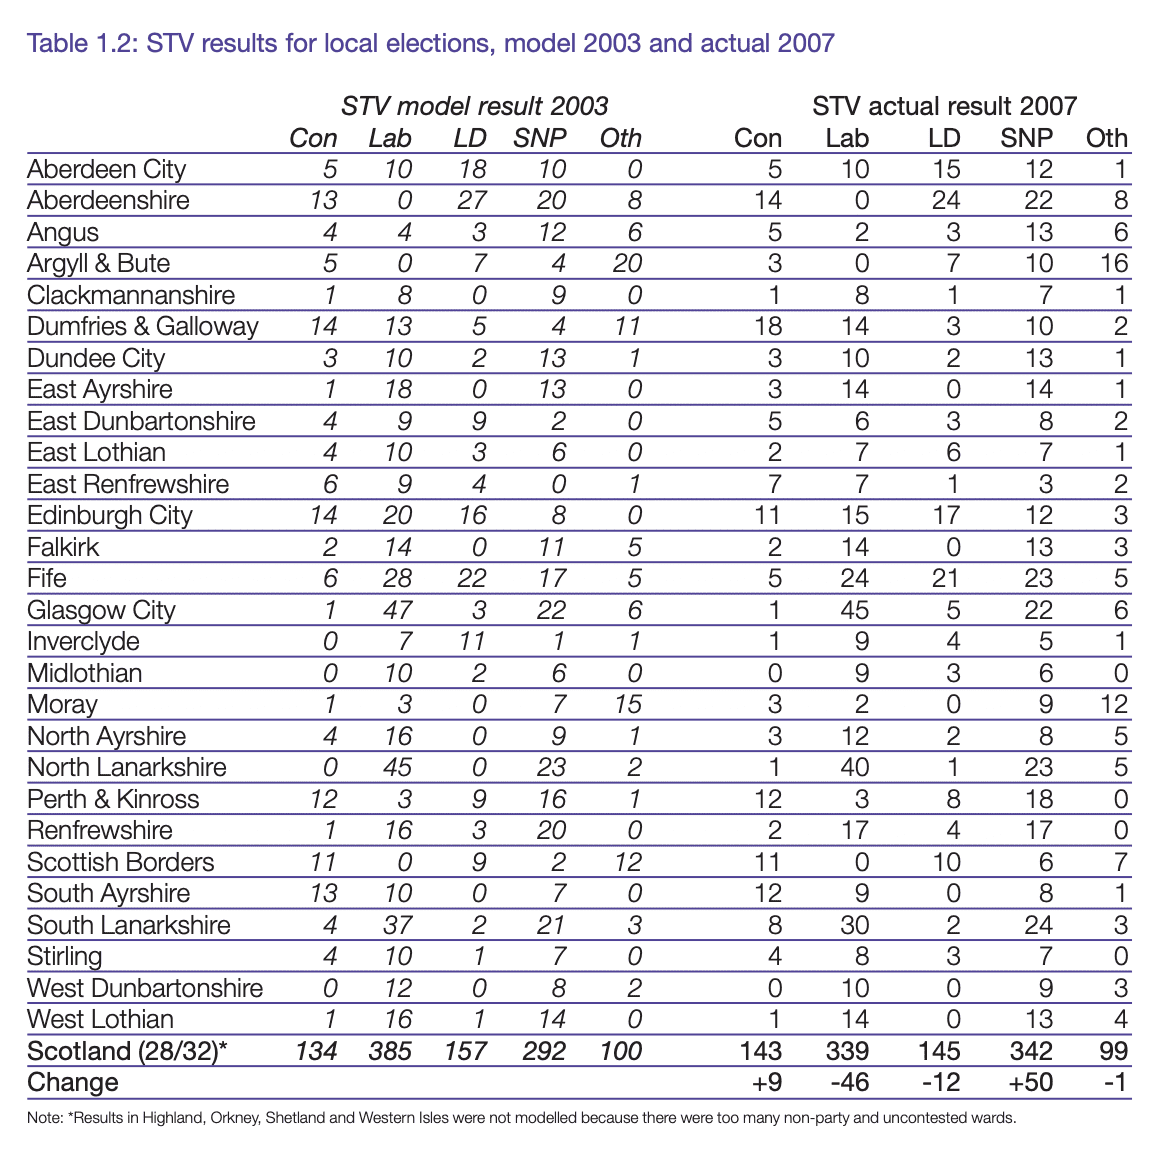
The ERS estimates of what would have happened under STV in 2003 are reproduced below, to show the extent to which there was a real change in party fortunes among the electorate in 2007. The results still show a clear national pattern of the SNP making gains from Labour.
Some of the most dramatic apparent changes since 2003 are almost entirely a correction to the previously very unrepresentative results of council elections, such as Labour winning 71 out of 79 seats in Glasgow on 47.6 per cent of the vote in 2003. Labour’s losses in Glasgow, compared with the notional STV result in 2003, are in fact quite minor. In Renfrewshire Labour actually did a little better in 2007 than it would have done under STV in 2003, despite being a few seats down on the actual FPTP result. In several authorities – such as North Ayrshire, Stirling and South Lanarkshire – Labour made large losses, both because of the system change and falling support. But the general pattern was for attrition of Labour strength from both sources.
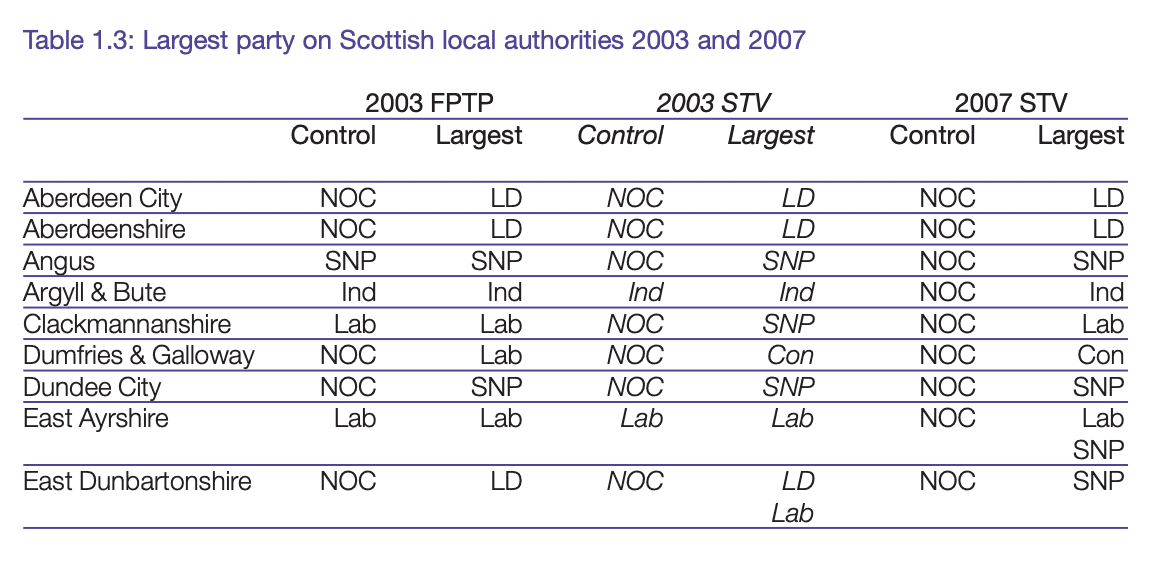
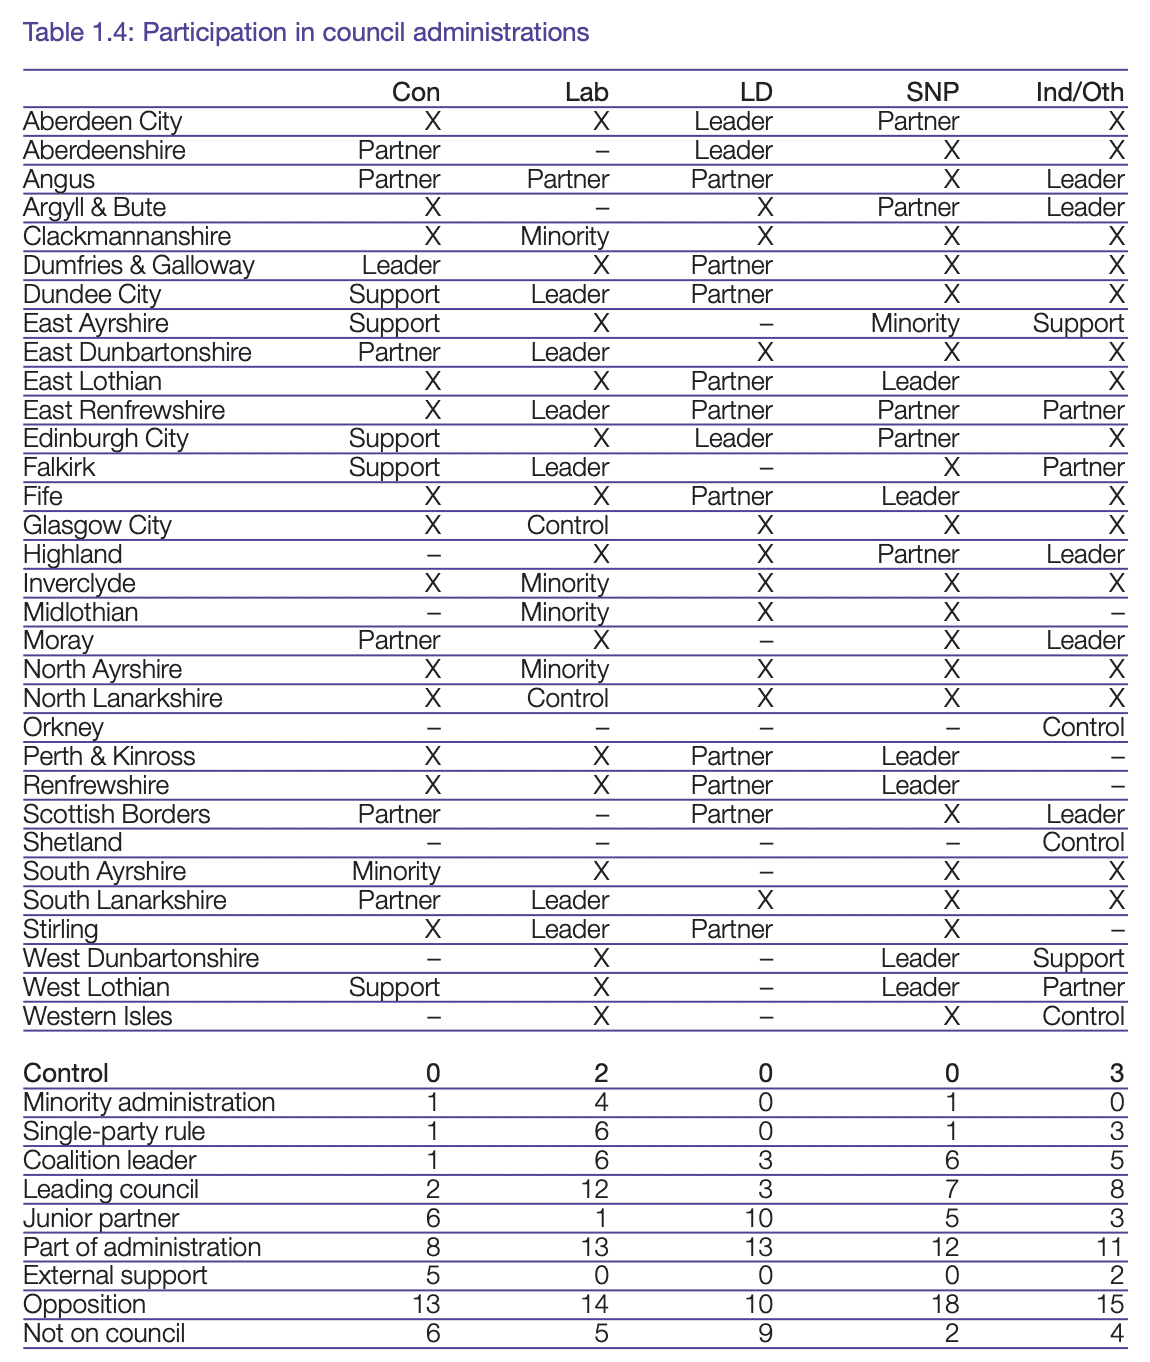
Who runs Scotland’s councils?
As there are now so many councils under no overall control, it is important to distinguish between the different configurations of no overall control (NOC), and how these shifted between 2003 and 2007.
When councils are under no overall control, a wide variety of governing arrangements can be made between different parties and independent candidates. This will no doubt emerge as a fruitful area for further research: seeing exactly how each administration has been formed, what forms agreements between parties take and what effect these arrangements have on policies pursued by the council.
How did the results differ from previous elections?
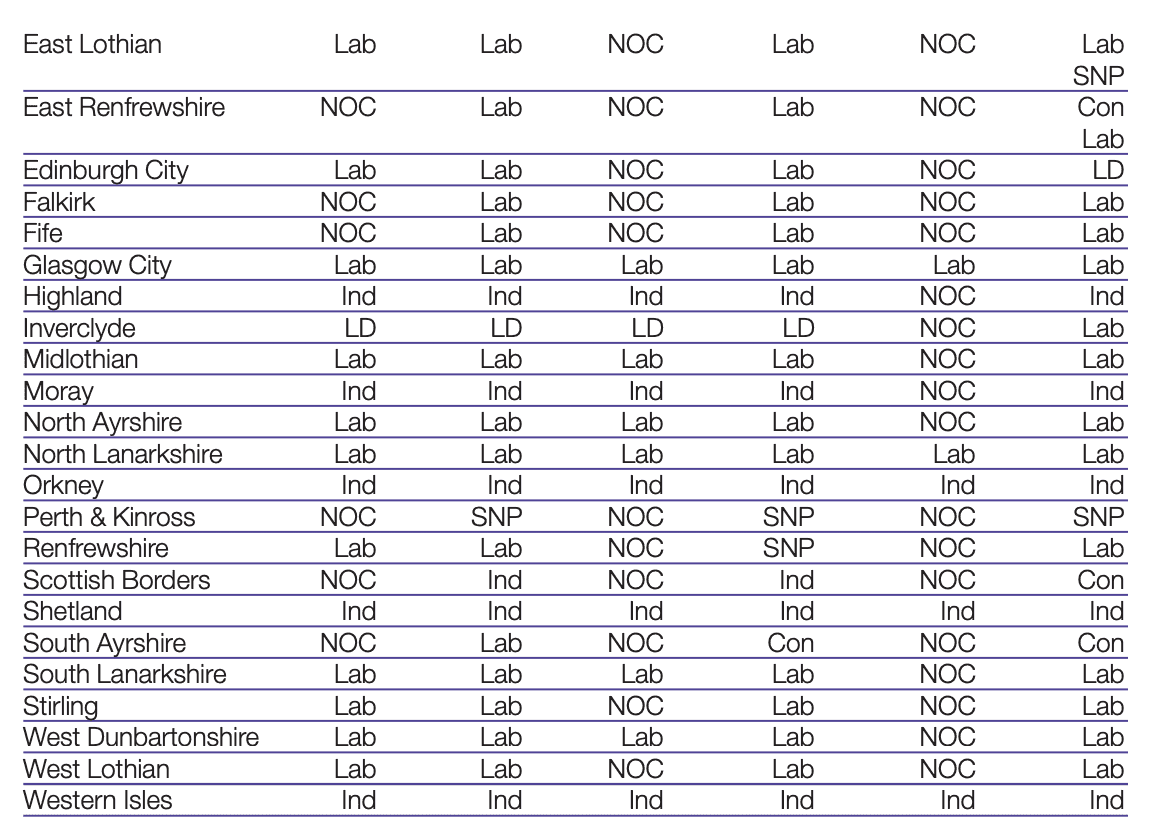
Compared to the 2003 FPTP results, Labour lost Clackmannanshire, East Lothian, Edinburgh, Renfrewshire, Stirling and West Lothian, and the SNP lost Angus (none of which would have been majority controlled under STV on the 2003 results). Labour also lost East Ayrshire, Midlothian, North Ayrshire, South Lanarkshire and West Dunbartonshire, and the Liberal Democrats lost Inverclyde, which would have been majority councils in 2003 under STV. The Conservatives also lost South Ayrshire, which they had controlled thanks to a by-election, and the Liberal Democrats lost their effective control over East Dunbartonshire.
Ever since the new local government structure was imposed in 1995, the major trend in Scottish local government has been for Labour to fall back from the high point reached in the 1995 elections, and for the number of councils under no overall control (NOC) to increase. In 1995 Labour controlled 20 out of 32 councils, which had fallen to 13 by the time of the last FPTP elections in 2003. Meanwhile, no other party had managed to replicate Labour’s dominance, and the number of ‘hung’ councils under no overall control rose from only three in 1995 to 11 in 2003. Five mainly rural councils remained with Independent majorities all the way through from 1995 (or 1994 in the case of the Island councils) to 2003.
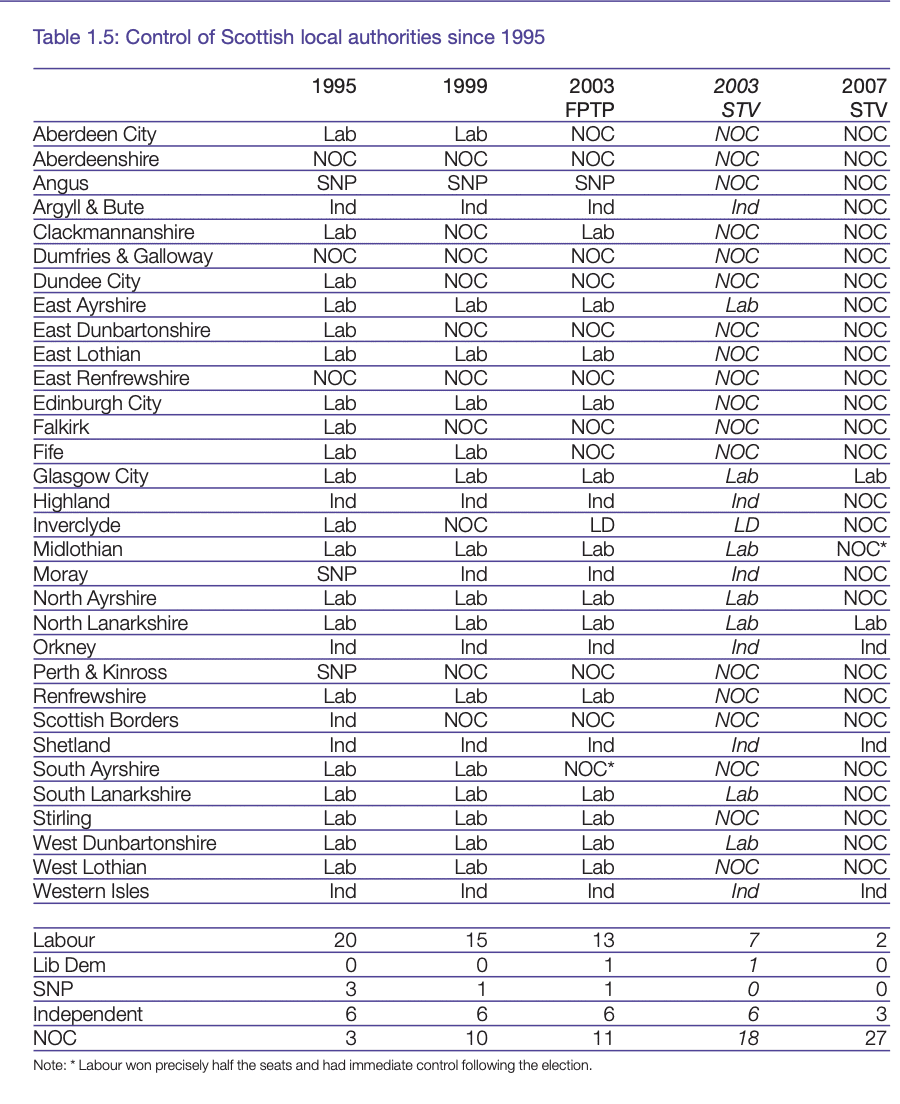
There were 13 councils in which a party (as opposed to Independents collectively) won a majority of votes cast in 1995. The SNP topped 50 per cent in Angus, and Labour managed this in Clackmannanshire, Dundee, East Ayrshire, East Lothian, Falkirk, Glasgow, Midlothian, North Ayrshire, North Lanarkshire, South Ayrshire, South Lanarkshire and West Dunbartonshire. Labour’s dominance reflected the intense unpopularity of the Conservative government at the time, and the ascendancy of Labour as the party that was best placed to defeat the Conservatives.
By 2003 there was majority support for a party in only one local authority, namely Labourcontrolled North Lanarkshire, and all other council majorities depended on only a minority of votes cast. Labour ran Edinburgh on the basis of a little over one vote in four, with 27.4 per cent of the vote. Conservative popularity had not recovered much (outside the party’s target council of South Ayrshire) but Labour’s dominance was steadily eroded by the rise of the Liberal Democrats (Inverclyde) and the SNP (Renfrewshire, Dundee), and to some extent the growth of ex-Labour or anti-Labour Independents in central-belt authorities such as Falkirk.
The change to STV, comparing the real FPTP results with the notional STV results of 2003, would have translated this lack of majority support among the electorate into a larger number of councils under no overall control in 2003. The estimated results would have left Labour with seven councils (North Lanarkshire plus East Ayrshire, Glasgow, Midlothian, North Ayrshire, South Lanarkshire and West Dunbartonshire, where the party was either close to majority support or had a large lead over its nearest opponent) and the Liberal Democrats with one, Inverclyde.
Part of the reason for the decrease in singleparty dominance in local authority elections is to do with medium- and long-term political trends, such as the continuous slide in levels of support for the largest local parties since 1995 that has happened in both Scotland and England. If FPTP had been retained, the likely outcome of the local elections would have been a situation where the ruling party in most of Scotland’s councils had less than 40 per cent support from the local electorate. This situation would not be considered acceptable for the Scottish Parliament.
Another reason for the decline is the increased choice available in 2007 under STV. Voters had a wider range of candidates from which to choose than they did in 2003, and were also not constrained by considerations of tactical voting. Edinburgh voters, for instance, who had already showed considerable Green support in Scottish Parliament elections in 1999 and 2003, had the option of voting Green for the city council which they did not have in 2003.
Did the results really represent how people voted?
STV delivered broadly proportional results in the elections to Scottish local authorities. The large proportion of councils under no overall control reflected the fact that no party polled a majority of first preference votes cast, although Labour fell only just short in North Lanarkshire. Independent candidates polled more than half the votes in the three Island authorities. In contrast to 2003 and previous local elections, it was rare for a party to score more than 40 per cent of first preferences. The only places where a party did this were:
- North Lanarkshire, Labour (49.3 per cent)
- Glasgow, Labour (43.3 per cent)
- East Ayrshire, Labour (41.9 per cent)
- South Lanarkshire, Labour (40.2 per cent)
In Dundee, the SNP won 39.97 per cent of first preferences, the highest share for any party other than Labour in any local authority.
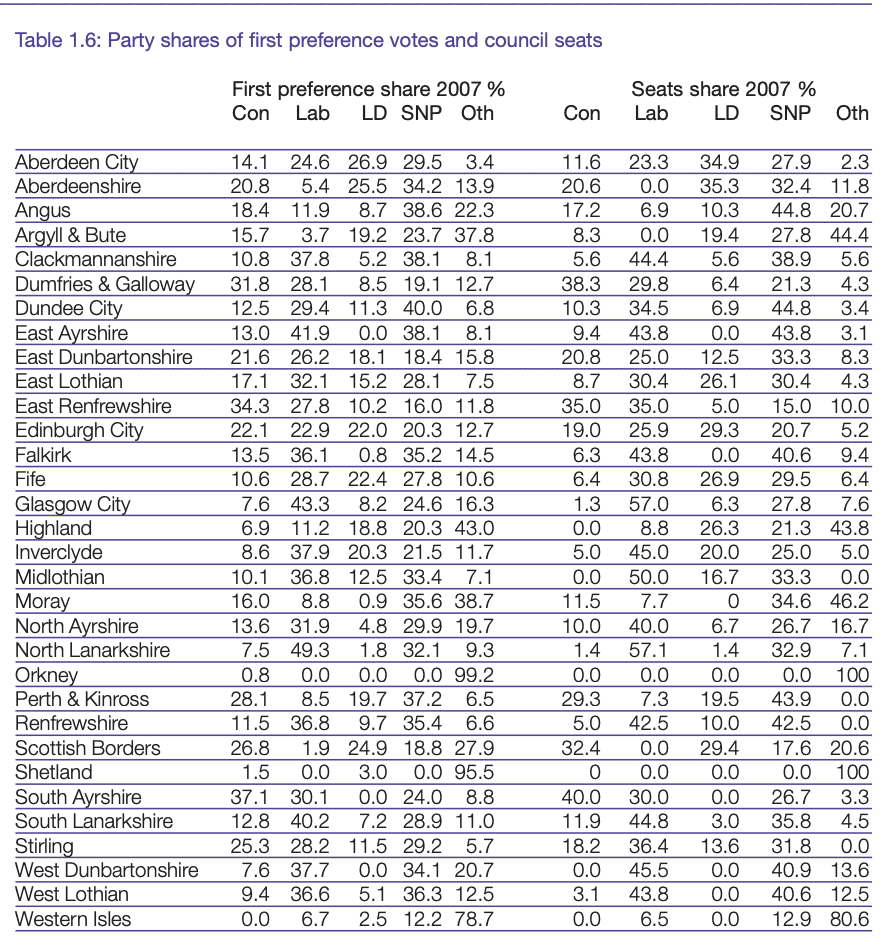
Where there was a significant body of voters choosing a party, that party received representation in the council chamber. The Midlothian Conservatives, who received 10.4 per cent of first preferences, were the largest unrepresented party. In contrast, in 2003 the SNP won 24.4 per cent of the vote in the same authority and won no seats. STV has brought such extreme distortions in the relationship of seats to votes to an end.
STV has also ended the egregious situation where a party can win a majority of seats on a very small share of the vote, as Labour managed in Edinburgh when less than 28 per cent of the vote sufficed to maintain overall control in 2003. STV has also prevented parties from winning overall control in authorities despite being outpolled by another party, as in Renfrewshire in 2003. More details of how STV has improved the representative quality of Scotland’s council chambers are available in the Appendix, which gives the election results council by council.
In comparing electoral systems, it is important to be aware that first preferences are not equivalent to FPTP votes. STV means that voters contribute more information about their choices than is possible under other systems. Take, for instance, two voters whose first choice is Green. Mr A is hostile to Labour and chooses the Liberal Democrats and SNP as his next preferences, ranking Labour at the bottom. Ms B is basically a Labour supporter, but knows the Green candidate and gives her a first preference and then votes Labour second.
Looking only at first preferences means that one assumes that the ‘votes’ of these people express the same political choice. If there are a lot more people who think like Mr A, as opposed to Ms B, then an STV election result will reflect this fact. This is why sometimes candidates with more first preference support lost out during the count to candidates who were more able to gather support from people who had made their first choice for another candidate. FPTP would not recognise any of these different political opinions, which electors were able to choose to express under STV, unless people felt forced to abandon their true party and vote tactically.
Parties and candidates vary in the extent to which they attract transfers, and this affects their share of seats. In some cases, parties (notably the SNP) did not stand enough candidates to win a proportional number of seats – simply put, you can’t win a seat if you don’t put up a candidate. Also, the largest party – particularly when the smaller parties represent very different alternative views – tends to enjoy something of a winner’s bonus. This helped Labour in Glasgow, where voters for other parties – Conservatives, Liberal Democrats, Greens, Socialists and others – often would not support each other’s candidates against Labour.
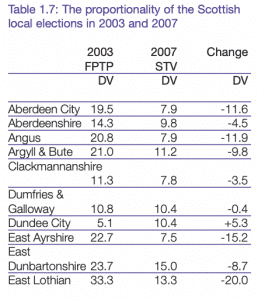
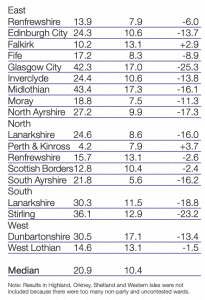
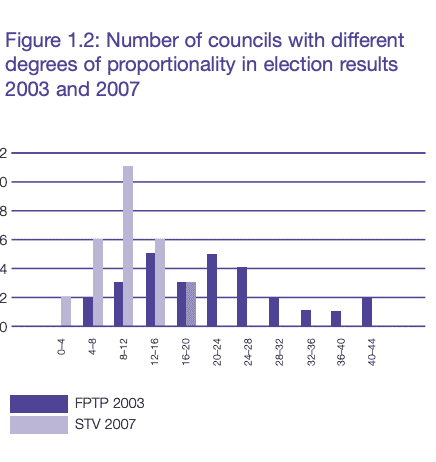
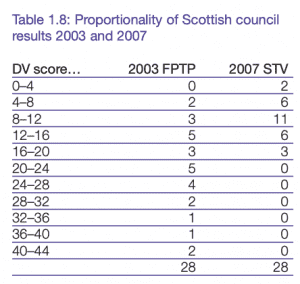
But the evidence for how well STV relates votes to seats is not just anecdotal – it can be demonstrated that the 2007 results were systematically not only more proportional than the 2003 FPTP results, but also achieved a very good relationship between seats and votes. One measure of how closely seats and votes are related is known as the ‘DV score’ (there is also a variant, DV-1, which excludes votes cast for the very smallest parties). The smaller the DV score, the closer the result in seats is to the votes cast by the electorate. The DV scores for the 2003 and 2007 local elections are given in the Table 1.7.
FPTP elections, as with Dundee in 2003, sometimes coincidentally give a proportional outcome in the manner of a stopped clock being right twice a day
The Scottish local government results suggest that even a relatively small-district form of STV is not only a considerably more representative system than FPTP, but also tends to produce more than just a reasonable concordance with voters’ first preferences. Dunleavy, Margetts and Weir (The Guide to Electoral Reform in Britain, Democratic Audit, 1998) refer to ‘the best European PR systems, which hit between 4–8% [sic]’ DV scores. In 8 of the 28 comparable results Scottish STV hit this benchmark or was even closer to strict proportionality (Moray DV score 3.3). The median DV score was only 10.4, not too far outside Dunleavy et al.’s range of very proportional scores, and the highest scores around 17 (by comparison, the FPTP results in 2003 had a median of 20.9 and the highest scores around 43, and the scores in UK general elections often exceed 20). Far from being only contingently proportional, STV seems systematically to give a pretty close relationship between party first preference votes and seats, even with small districts.
A limiting factor on proportionality is that STV involves voting in wards. Differences in the distribution of the vote, and turnout, can make a difference in any electoral system where voters are divided into districts, but much less so in STV than in FPTP. However, there are a couple of authorities where the way in which the wards were drawn up seems to have affected the proportionality of the overall result. The SNP in East Dunbartonshire had around 20 per cent in each ward – enough for one seat per ward with transfers in three-member wards, but if there had been four-member wards there was only enough support for a single SNP seat in each of those. The report deals in more detail with the issue of ward size in Chapter 9 below
Conclusion
The 2007 local authority elections in Scotland produced a large increase in the number of councils under no overall control. There were no councils where a party won a majority of the first preference vote (and few where anyone came close) and this was reflected in the election results as it had not been before. In two councils, North Lanarkshire and Glasgow, Labour polled strongly enough (over 43 per cent) to win overall majorities in these important authorities, something no other party managed despite 2007 being a low ebb of Labour support.
To some extent, the results were a consequence of the continuing decline in Labour’s share of the vote since the party’s high watermark in 1995, but the change in the system did cause a sudden and no doubt painful correction in many areas in which Labour had previously been over-represented.
The STV results were proportional to the votes cast in Scotland’s councils to a considerable degree. The Scottish local elections are evidence that, even with relatively small (three or four-member) wards, STV produces results that are an accurate reflection of the way people have voted.
The Appendix gives the detailed picture of how STV has worked in each local authority.
Chapter 2: The political parties and the local elections
Most local authorities in Scotland are structured on a party political basis – they are administered by parties or alliances of parties, most councillors owe allegiance to one or other party, and most votes are cast for candidates nominated by political parties. There are only three councils out of 32 in which party politics is not a significant factor, namely Orkney, Shetland and Western Isles.
Voters usually line up in a broadly similar way to the choices they make in other elections – particularly as in the last three sets of elections Scottish Parliament and local government voting has taken place at the same time. In 2007, as before, most parties ran an integrated campaign covering both the Scottish Parliament and local government elections. However, the range of choice of candidates on offer at the three levels of election (constituency, region and ward) is often different, which is reflected in different results.
Choice was usually most constrained at the constituency level, where minor parties tended not to stand, compared to a wide (but often ineffective) choice of regional lists and an intermediate (but perhaps more meaningful) amount for local elections.
Some voters also cast local election ballots on the basis of personal loyalty to one or more candidates, or on local issues to do with the performance of the council.
This chapter gives some information about the performance of the four major parties, some minor parties and Independents in the Scottish local elections.
The Scottish Conservative and Unionist Party
Candidates
The new electoral system marked an important change in Conservative electoral strategy. The party stood candidates in every ward in mainland Scotland except one, the Fortissat ward of North Lanarkshire. In many areas this was a new development and a significant increase in voter choice. The Conservatives were the party that saw the biggest expansion in its reach in 2007.
There were broadly two types of area in which there had not previously been much Conservative activity in local elections. In some, such as Highland, the party has not put forward candidates much because Independents have dominated. In mainland rural areas the rise of the Conservatives and decline of old-style Independents has been taking place for years – for instance Dumfries & Galloway council has seen Conservatives entirely replacing Independents since 1995. The Conservatives have still, for the most part, kept out of elections for the three Island authorities. While the change in electoral system may have accelerated the pattern in some councils such as Moray and Highland, it is part of a long-term trend.
In other areas, the Conservatives were too weak in terms of organisation to find more than a few candidates, and generally also weak in electoral support, and did not run many candidates. Examples of this pattern include Falkirk, Inverclyde and West Dunbartonshire. There were also areas of large authorities such as Fife and Glasgow where Conservatives dared not tread. STV allowed the party to achieve complete coverage in such authorities, often with fewer candidates to find, and those candidates had more chance of electoral victory.
Results: votes
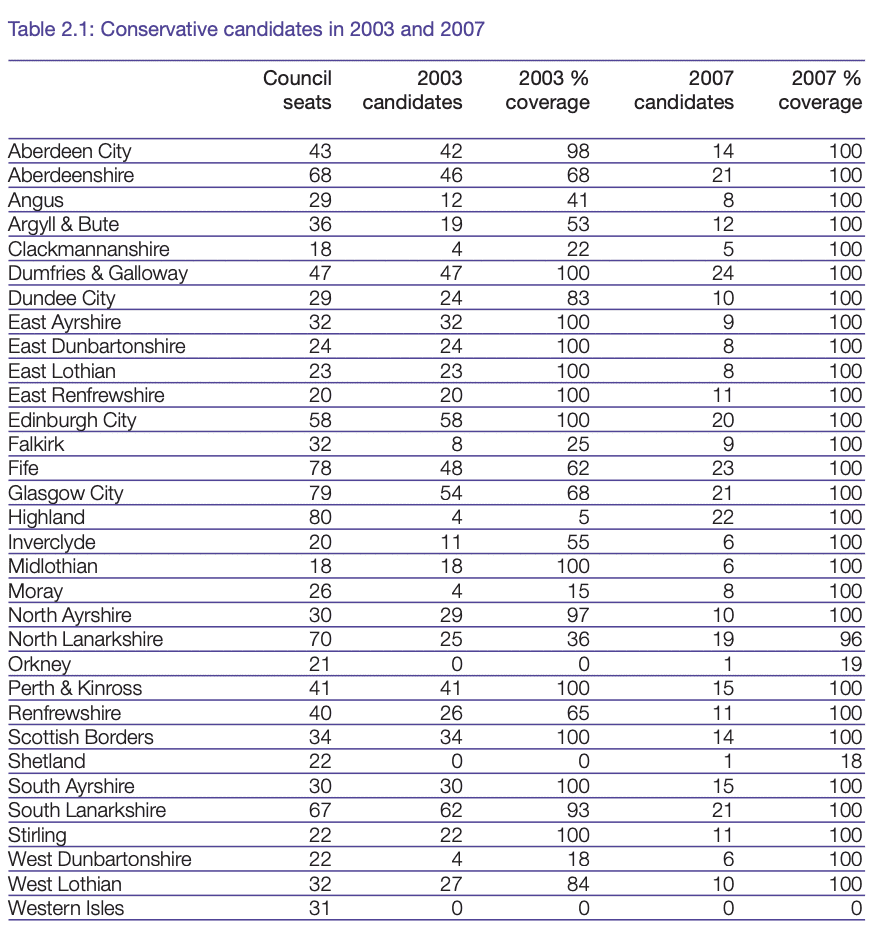
Across Scotland, the STV elections saw a small Conservative advance in votes (comparing first preferences in 2007 to votes in 2003). The 2007 elections, nationally, left the Conservative vote more or less where it was, but there were local variations. The biggest advances were usually in areas where there had been a large increase in the number of candidates – local election shares of the vote are determined by the parties’ supply of candidates as well as the voters’ demand for them.
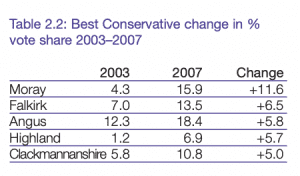
In Moray and Angus, the increase in the Conservative vote since 2003 reflected the availability of more candidates in areas where Conservative potential was already apparent. In other areas, such as Clackmannanshire and Falkirk, it represented a foothold in areas where the party has not been a factor before – in those two authorities there had previously been a Labour–SNP contest that offered little to the Conservative-inclined.
However, the Conservatives saw a decline in some areas where they had previously been part of a two-party system, notably in North and South Ayrshire.
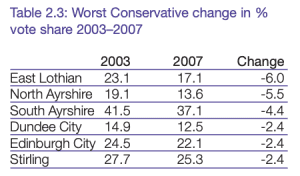
In councils where there has been a longestablished pattern of multi-party competition, such as Aberdeen, Edinburgh and Stirling, there was little change in the Conservative share since 2003 (or previous elections). Taking the long view since 1995, the biggest Conservative increases in vote share were in several rural councils where Independent representation has been gradually displaced by party politics, such as Dumfries & Galloway (+21.6), Moray (+13.7), Scottish Borders (+12.0) and Aberdeenshire (+10.0).
Results: seats
In terms of seats, the Conservatives were somewhat ahead of where they were in 2003, with a net gain of 20 seats from the FPTP results and nine compared to the STV model results.
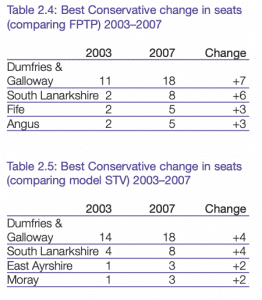
South Lanarkshire and Dumfries & Galloway were the leading success stories under either measure, with gains of four seats in each council on the 2003 STV model results and six and seven seats compared to FPTP.
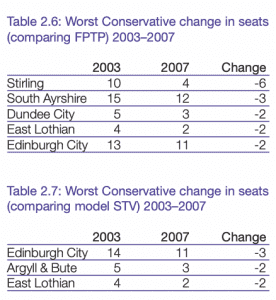
Edinburgh and East Lothian each saw the Conservative position slipping back most significantly when compared with the 2003 STV model results. Gains in some councils, such as Fife and South Lanarkshire, were mostly because the new system gave fairer representation to Conservative voters, while in others, such as Dundee, South Ayrshire and most spectacularly Stirling, Conservative losses were because they had previously been overrepresented.
As well as showing the flag, STV allowed the Conservatives to gain representation in some areas which have been almost entirely barren. Even under STV, the Conservative Party’s support is too low to hold out much hope of winning a council seat in many areas of urban central Scotland, but it does present possibilities that were lacking before. A minority Conservative vote has always existed in Scotland’s industrial heartland, providing a base of support, and the campaigning efforts of Conservative candidates, and sometimes the mistakes of other parties in nominating too few candidates, can allow victories in even the most unlikely sounding areas. The idea of the Tories having a representative for Motherwell South & Ravenscraig on North Lanarkshire council, for instance, is unfamiliar. In both North Lanarkshire and Inverclyde they won seats on councils which had no Conservative representation in 2003. The Conservatives also made something of a breakthrough in South Lanarkshire by returning a group of eight councillors compared to two in 2003, making up a significant group on the council which has successfully used its position to become part of the administration.
The Conservatives, like other parties, lost out in areas where they had previously relied on small areas of strong support to return knots of councillors. The Conservatives in Stirling had been dependent on rural wards, and in Dundee Broughty Ferry had provided a core of support that was enough to return several councillors. In each case they had to cede seats to other parties, but did not manage to expand their appeal into the rest of each authority. One of the consequences of STV is that each party is taken out of its previous comfort zones in searching out support. The Conservatives need to look at the 2007 experience in order to develop means of doing so.
Results: transfers
The Conservatives were consistently weak in picking up transfers from supporters of other parties (although they did rather better when votes were redistributed from small-c conservative independents). Labour and SNP voters in particular shunned Conservatives with Part 1 What happened in the elections? The political parties and the local elections Local authority elections in Scotland 3 May 2007 their lower preferences; it was rare for more than 7 per cent of transferred votes from these sources to end up with the Conservative candidate, but not uncommon for less than 3 per cent to do so (when there was still a reasonable number of parties left in the count). An interesting phenomenon with Conservatives receiving transfers was that they received more in areas where the Conservative first preference vote was relatively high. This may be an indication that the Conservative inclinations of an area feed through to lower preferences cast by supporters of other parties, or perhaps personal support for Conservative incumbents. It was striking that, for instance, the Conservatives picked up a reasonable share of Green and even Solidarity transfers in middle-class wards such as The Ferry in Dundee, and Colinton & Pentland Hills in Edinburgh.
The results of the Conservatives not being favoured for transfers was that the party’s candidates sometimes found themselves overhauled during the later stages of the count. Twenty-six Conservatives who looked as if they were in a winning position on the first stage of the count were overtaken by other candidates through transfers, while only two Conservatives managed to overtake someone else. If the Conservatives could overcome these negative views, the party would be much better placed to win STV elections. As it is, the party needs to get much closer to winning a whole quota (a quota is the share of the vote necessary to ensure a candidate’s election and is equivalent to 25 per cent in three-member wards and 20 per cent in four-member wards) in order to elect a candidate than the other main parties.
Results: councils
The Conservatives control no local authorities outright, and lost control of South Ayrshire, over which they exercised a tenuous grip for parts of the 2003–7 council term. However, Conservative councillors lead administrations in South Ayrshire as a minority, and Dumfries & Galloway in a coalition, and there are six more authorities in which the party is a junior partner in a coalition, in two of them (East Dunbartonshire and South Lanarkshire) in the unfamiliar role of working with Labour. In several other authorities, Conservative councillors have influence, either through informal support for another party’s administration or through the day-to-day negotiations that take place with minority government.
The Scottish Labour Party
Candidates
Labour nominated 920 candidates in 2003, with complete slates of candidates in 15 out of the 32 authorities. The party left only two councils, Orkney and Shetland, with no candidates at all.
In 2007 Labour put up 520 candidates. However, this covered a greater proportion of the Scottish electorate than in 2003. Twenty-two councils had complete slates, and the policy of not contesting elections in Orkney and Shetland continued. Other councils in which a majority of wards had no Labour candidate included Scottish Borders and Argyll & Bute. In all, only 50 out of 353 wards had no Labour candidate.
Labour was the party that had to deal most often with the issues involved with fielding multiple candidates in a ward. Just under half of all the incidences of multiple candidates involved Labour
Results: votes
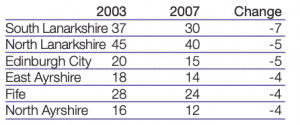
The 2007 elections were painful for Labour. Labour’s vote was down across nearly all of Scotland. Labour’s worst results, in terms of losing votes compared to 2003, came in a group of authorities in the west of Scotland, with North Ayrshire showing the largest drop (12.3 per cent) and several other authorities also contributing big drops (West Dunbartonshire, East Ayrshire, South Lanarkshire).
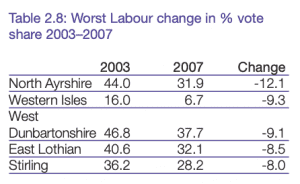
Ironically, two of Labour’s best results (Inverclyde and Renfrewshire) were in the same general area. East Lothian and Stirling also saw big drops in the Labour vote. These results reflected local issues (particularly in East Lothian and Inverclyde) and changes in the pattern of party competition (Stirling and South Lanarkshire may fall into this pattern, and Labour’s good result in Dumfries & Galloway was at the expense of the declining Independents).
Results: seats
Labour had enjoyed over-representation in many Scottish councils for decades and had to undergo a large downsizing in one election. The damage was compounded by the adverse national climate in 2007, and by the willingness of other parties to cooperate and form administrations that exclude the Labour Party. Labour suffered severe losses of seats in the two big cities and the Lanarkshire conurbation, where the party had dominated.
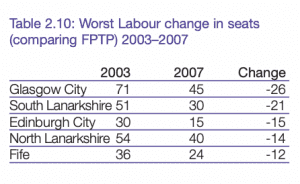
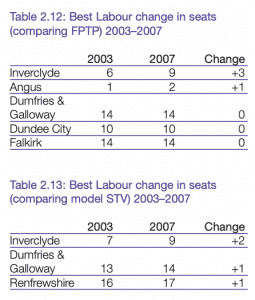
Even comparing the 2007 result with what would have happened in 2003 had STV been in use then, Labour still shed seats in Lanarkshire and a number of other urban authorities. It is worth noting that Glasgow, where Labour lost the most seats compared to the FPTP picture in 2003, was not among the worst results once the effect of electoral system change is accounted for.
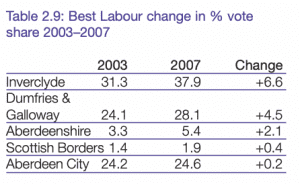
Even in 2007 there were some local successes for Labour. Labour managed to gain some ground in Inverclyde, where the Liberal Democrats collapsed, and held steady in some other councils. In Dumfries & Galloway Labour continued its slow advance.
At ward level, the party now has a councillor in Newton Mearns South, an affluent ward in East Renfrewshire, and in East Sutherland & Edderton in Highland. The party now has footholds in the sorts of area where it never had a chance before, and future STV elections may see Labour expanding further into new areas.
Results: transfers
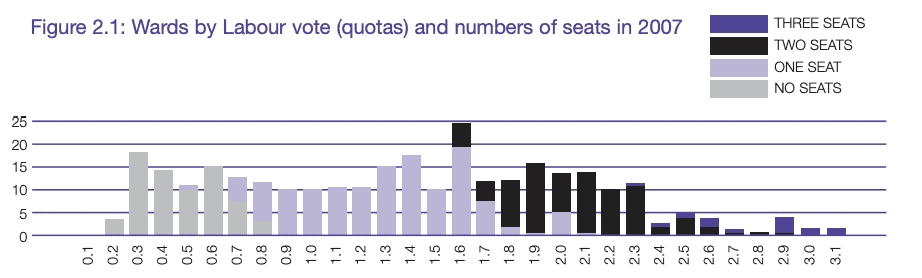
Labour could generally rely on electing a candidate with more than 0.67 of a quota in a ward. When votes were transferred from one Labour candidate to another during a count, either because of a surplus or a candidate being eliminated from the poll, there was quite a high degree of solidarity in the Labour vote. Between 60 and 80 per cent of Labour votes transferred to the Labour running mate, a finding that should cause some satisfaction to Labour’s campaign managers. The extent of leakage and the direction of transferred votes are fertile directions for future electoral research.
Labour lost rather more than it gained when one considers the cases where candidates overtook other candidates during the count to win a seat. There were eight cases where a Labour candidate managed this, but 25 when transferred votes worked against Labour. This was partly a function of the anti-Labour political climate of 2007, when the party was the incumbent at Westminster, Holyrood and very often the civic centre as well. This may be different in the next set of local elections and Labour might well be in a better position to attract transfers. In elections in which Labour is doing well, like the 1997 Westminster election or the 1995 local government elections, transfers would probably swing strongly towards Labour.
Results: councils
Labour retained control of two councils, Glasgow and North Lanarkshire, which are the only councils over which any party has majority control. Labour also has exactly half the seats in Midlothian. However, compared to the 2003 notional results under STV, Labour did lose control of East Ayrshire, Midlothian, North Ayrshire, South Lanarkshire and West Dunbartonshire. In addition, Labour lost Clackmannanshire, East Lothian, Edinburgh, Renfrewshire, Stirling and West Lothian which the party had won under FPTP in 2003.
However, having suffered these results in 2007 Labour remains a strong force on many local authorities in Scotland, with majority control in two powerful councils, and in four years’ time may well be in a position to move forward again. The party could reasonably hope to recover the five councils it might have won under STV in 2003, and also to develop strategies to broaden its appeal in other areas and run councils based on mass support from local electors rather than a trick of the FPTP electoral system.
Labour remains the party with the largest number of council leaders: 12 councils are led by Labour in a range of different types of administration, including majority, minority and coalition with a range of partners. In two councils Labour governs in coalition with its great UK rivals, the Conservatives; in one, East Renfrewshire, there is an agreement with its main rival in Scotland, the SNP.
The Scottish Liberal Democrats
The Liberal Democrats’ pattern of putting up candidates was patchier than that of the other parties. While they had complete coverage in areas of relative strength and the largest local authorities like Edinburgh and Glasgow, there was often incomplete coverage in other areas. In four local authorities (East Ayrshire, Orkney, South Ayrshire and West Dunbartonshire) the party ran no candidates at all.
Results: votes
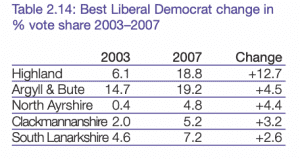
The Liberal Democrats, as in the Scottish Parliament election, had a disappointing overall result although there were some local causes for celebration. The party managed to squeeze into contention in several councils in which it had previously struggled to make an impact, such as North Ayrshire and South Lanarkshire. It also managed to attract extra support in some areas such as Highland and Argyll & Bute, in which Liberal Democrat voting is well established at Westminster and Scottish Parliament level but has hitherto not trickled down to local election voting.
However, the party also suffered some severe defeats, particularly in the two areas in which it had previously run the council, Inverclyde and East Dunbartonshire. The result in Inverclyde, where the party’s vote slumped 22.3 percentage points, was a much worse rebuff than any suffered by a Labour council. The local variation in the change in the Liberal Democrat vote was, by some margin, the largest of any of the four main parties.
Results: Seats
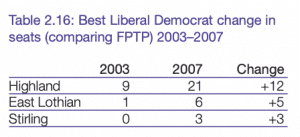
Highland topped the list of Liberal Democrat
gains, as political party candidates displaced
Independents. The party also did well in East
Lothian, where it had performed convincingly in
the 2005 Westminster election and had a
number of local issues to campaign on. The
Liberal Democrats also gained representation
in Stirling, which now seems to have vigorous
four-party politics.
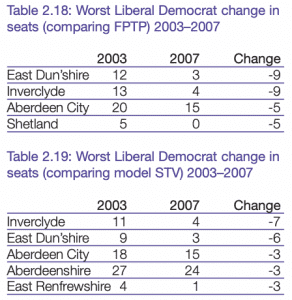
Inverclyde and East Dunbartonshire were again the worst areas in terms of seats, although Aberdeen (where the party had also had a leading role in recent years) saw a poor result as well. The party more or less withdrew from local politics in Shetland, causing a rather artificial drop in votes and seats.
Results: transfers
The Liberal Democrats did well by attracting second preferences from people who had voted for other candidates. There were 31 cases, or 18.7 per cent of all the party’s councillors, where a Liberal Democrat candidate was not in a winning position at the first stage of the count but came through to win on transfers. This is a considerable strength for the party, and enabled it to win seats where it was well short of a full quota of first preferences.
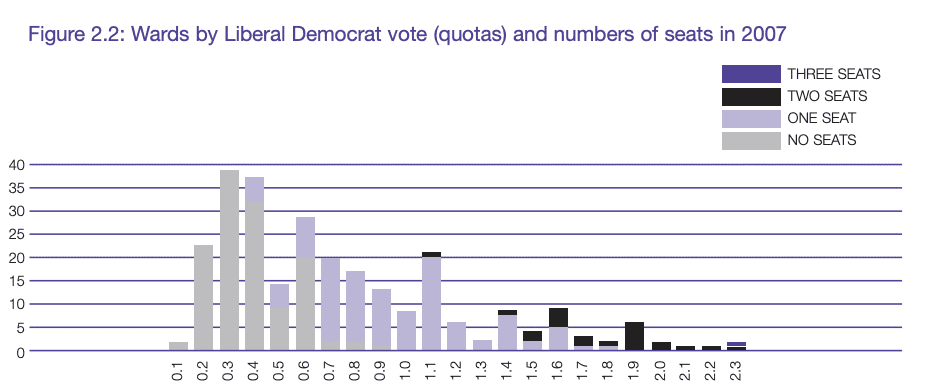
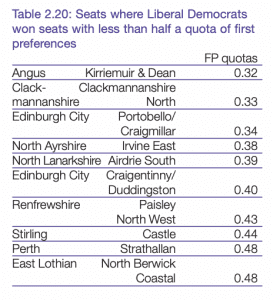
The Liberal Democrats won 10 seats in which the party had less than half a quota of first preferences, and five in which it had less than 0.4 of a quota.
In most seats in which the party had more than 0.6 of a quota, it managed to win a seat, failing in only five out of the 49 wards with a vote of 0.6 to 0.9 quotas. The boundary was 0.6, below which the majority were not elected and above which the vast majority were. However, this strength is a potential source of future weakness, in that the party depends on the second preference support of people who are not strongly committed to it for many of its seats. The experience of the elections in East Dunbartonshire and Inverclyde shows that the electorate can sometimes turn violently against the party, and it is very vulnerable to any withdrawal of the general support and sympathy it enjoys from the Scottish electorate.
Results: councils
The Liberal Democrats lost their majority control of Inverclyde and their effective control of East Dunbartonshire. They retained their position as the largest single party in Aberdeen and Aberdeenshire, and became the largest single party in Edinburgh. As well as Edinburgh, the party leads in Aberdeen and Aberdeenshire and is a partner in administrations in 10 other councils, making it equal with Labour as the party most often found governing a local authority.
The Scottish National Party
Candidates
The SNP contested every seat in every authority in Scotland with the exception of the three Island authorities (no candidates in Shetland or Orkney, and four of the nine seats in the Western Isles). The SNP therefore had the most complete coverage of any of the Scottish parties, although it was running fewer candidates than Labour (433 to 520). The SNP ran more candidates than any other party in 2003, but in that case they were mostly ‘paper’ candidates with little chance of winning because of the FPTP electoral system.
Results: votes
The 2007 elections were a considerable success for the SNP in local government as well as for the Scottish Parliament. The party became the largest force in Scottish local government with 363 councillors (Labour returned 348). Labour actually polled slightly more first preference votes, but its advantage over the SNP was greatest in Glasgow and Edinburgh where wards are large, while the SNP did better in some areas with smaller wards.
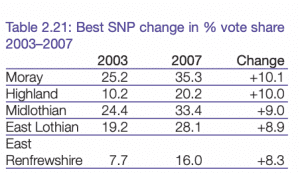
The rising SNP tide was relatively even across different local authorities. Its biggest growth since 2003 was in Highland and Moray, where it already has substantial support in Scottish Parliament elections but hitherto Independents have dominated in local elections (although in 1995 the SNP had won Moray). More directly political factors underlie its strong performance in East Lothian and Midlothian. In suburban East Renfrewshire, a marginal area between Labour and the Conservatives, the party had previously been very weak but broke through into contention in 2007.
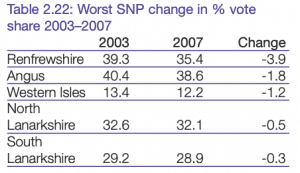
The SNP’s vote slipped a little in some of its strongest areas, particularly Renfrewshire and Angus. This reflects the more intense political competition from other parties in these councils – in Renfrewshire rather than a simple SNP v. Labour battle more voters had Conservative and Liberal Democrat options to choose, and some did so. The same is true in the Lanarkshire councils, where the SNP was previously the sole opposition to Labour in many wards.
Results: seats
The SNP’s representation surged across urban Scotland, with striking gains in Glasgow and Edinburgh compared to the FPTP results in 2003. However, this basically reflected support that had always been there but had been denied representation by the electoral system.
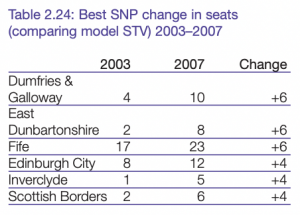
The SNP made steady progress in the majority of local authorities, with good results in Dumfries & Galloway (despite its disappointment in the Scottish Parliament election in Galloway), East Dunbartonshire and Fife (where the party polled particularly well around Glenrothes, just as it was winning the Fife Central constituency)
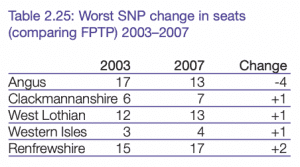
There was only one council with a net loss of SNP seats compared to 2003, and that was Angus where the SNP had previously had majority control. It is a common feature of FPTP election results that the leading party gets a disproportionate winner’s bonus, and Angus was a rare example of the SNP being favoured in this way by FPTP.
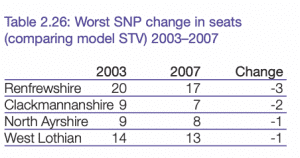
Compared with the national results in 2003, the SNP lost out in four councils, where smaller parties broke through in what had previously been two-party battles with Labour.
Results: transfers
The SNP polled a reasonable proportion of the vote almost everywhere in Scotland (coming in below 0.4 of a quota in only two wards, Kelso & District in the Borders and Caol & Mallaig in Highland). It can reasonably said that there are no wards in Scotland (with the possible exception of the Island wards left uncontested in 2007) where the SNP, with a favourable national background and a good campaign, could not win a seat.
The even distribution of the party’s vote, with most wards in Scotland having 20–25 per cent voting SNP, was the principal reason why it was extremely under-represented under FPTP. However, under STV this was enough to win representation in most wards in Scotland
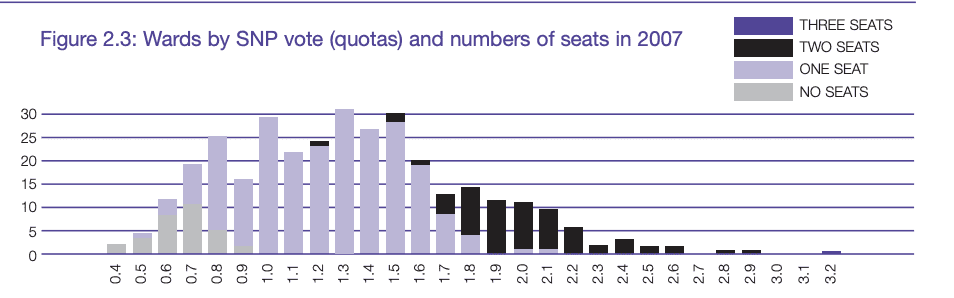
The SNP, like Labour, tended to be able to win the majority of seats in which it polled more than 0.67 of a quota. However, the SNP broke even on the number of candidates elected despite not starting the count in a winning position, with 14 overtaking others and 14 themselves being overtaken
Results: councils
The SNP does not have majority control of any authorities, having lost Angus in the 2007 elections. The SNP does run East Ayrshire as a single-party minority administration, and leads six councils where there is a coalition administration (four of them partnerships with the Liberal Democrats). In five more councils the SNP is a junior partner in running the council.
The Scottish Green Party
Candidates
No Green Party candidates stood in the local elections of 2003. The Green Party recognised that the electoral system was stacked against the party and, entirely rationally, concentrated its efforts on maximising its vote in the regional list ballot of the election for the Scottish Parliament.
In 2007 the Greens put up one candidate in each of 100 wards in 21 out of the 32 local authorities in Scotland. They offered complete slates in the big cities of Edinburgh and Glasgow, and 15 in the 20 wards of South Lanarkshire. In other areas, Green candidates were more scattered, but there was a measure of coverage from North West and Central Sutherland in Highland to Annandale East in Dumfries & Galloway. The larger number of candidates was a response to the increased opportunities to elect councillors that the introduction of STV involved.
Results – votes, seats and transfers
The 2007 elections saw the election of the first Green councillors in Scotland. Five candidates were successful in Glasgow and three in Edinburgh. Green candidates averaged 5.5 per cent of first preference votes, although this is composed of a large number of candidates with a share a little under this and a longer ‘tail’ of candidates winning a larger share. The following table lists the 19 wards in which the Greens polled more than 7 per cent of the vote.
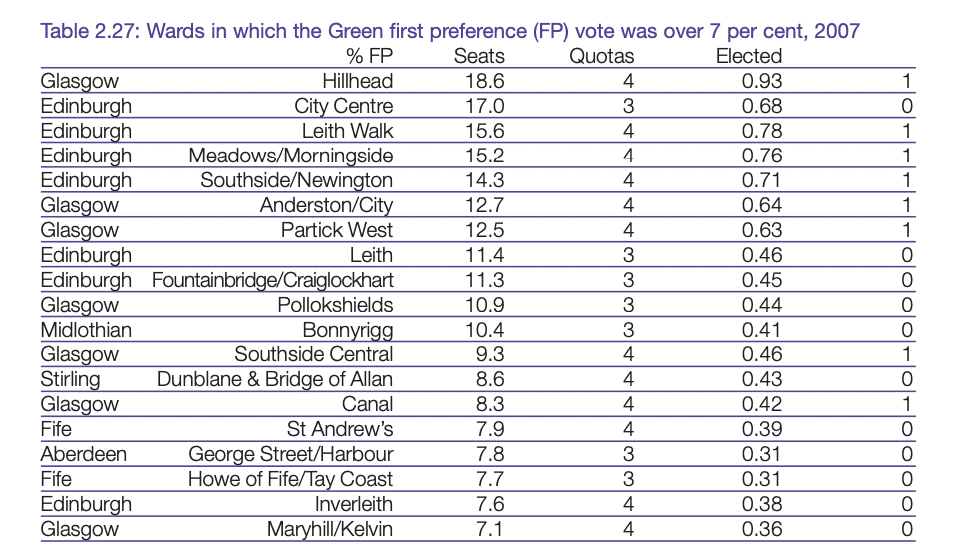
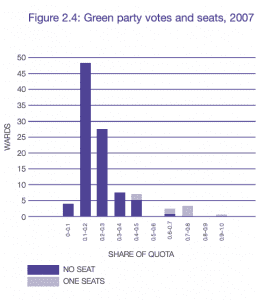
The Greens won every seat in which they won more than 0.45 of a quota in four-member wards (and one with 0.42 of a quota thanks to SNP under-nomination and a large SNP surplus that helped the Greens), but no seats (even with 0.68 of a quota, or 17 per cent, in Edinburgh City Centre) in any three-member wards.
The Greens’ ability to win seats without a full quota of first preference support anywhere indicates their transfer-friendliness, i.e. their ability to attract second and lower preferences from supporters of other candidates or parties. In Edinburgh, Greens benefited from fairly strong transfers from the two socialist parties (25 per cent from Solidarity and 32 per cent from the SSP), whose candidates were usually eliminated early in the count. They also gained transfers from all the other parties, particularly in cases where there were no candidates from the same party available to receive transfers
The Greens could even make significant inroads in a few cases where there were party colleagues ready to receive the transfer, as in Meadows/Morningside where only 54.5 per cent of a Liberal Democrat surplus was transferred to the running mate and 16.5 per cent leaked to the Green. This might suggest that Greens can profitably appeal for second preference support from identified supporters of other parties, and perhaps particularly to people who have a personal identification with a candidate but not necessarily his or her party.
However, the party’s fairly low share of the vote, at least in the circumstances of 2007, means that it will have difficulty reaching the threshold imposed by three- and fourmember seats, even with good inward transfers. To elect a candidate with 5.5 per cent of the vote, assuming that half a quota is going to be enough, would require eightmember seats, which most people would consider too large.
While an increase in the average size of a ward will lower the barriers a bit, the Greens still need more electoral support if they are to win more seats. To elect the 19 candidates who polled over 7 per cent would require sixmember wards at the very least. Increasing ward size would also involve larger wards being the units, and in many cases outside the big cities this would mean diluting areas of Green strength (such as Dunblane/Bridge of Allan) with surrounding, weaker territory – or imposing considerable demands on campaigners who will have to cover a large area.
In the short term, and almost certainly the long term as well, a Green strategy to win more councillors is going to require targeted campaigning to convert points of existing strength into areas with Green councillors. Some of these areas, such as Dunblane and St Andrew’s, are four-member wards. While the seats the party narrowly missed in Edinburgh (City Centre, Leith) and Glasgow (Pollokshields) have three members, the credibility and resources from having a group of councillors from other wards may help the Greens win more seats, perhaps even threemember seats, in Glasgow and Edinburgh, just as their initial breakthrough in the 1999 Scottish Parliament election led to more gains in 2003.
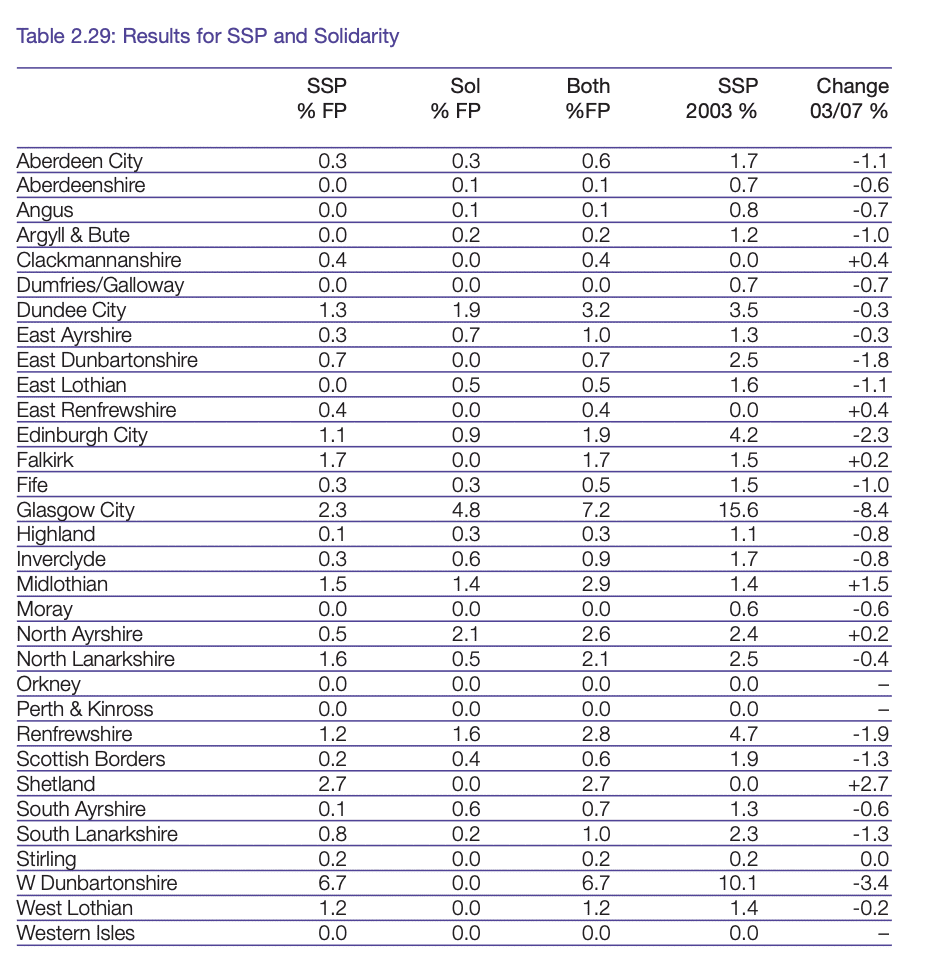
The Scottish Socialist Party and Solidarity
The position of the socialist parties in the runup to the 2007 elections was not strong. The 2003 elections for the Scottish Parliament were a considerable success for the Scottish Socialist Party (SSP) under Tommy Sheridan. The party won six regional seats in the Scottish Parliament. However, success in the local elections was limited, in considerable measure because of the FPTP electoral system that prevented the party from translating a respectable share of the vote in Glasgow into many seats. The SSP won a single seat in Glasgow and also one in West Dunbartonshire. Under STV, the ERS estimate is that the SSP would have won six seats in Glasgow in 2003, and was not too far behind winning several more. But the party split in 2006, with Sheridan leading a breakaway party named Solidarity, and its vote was squeezed by the rise of the SNP as the May 2007 elections approached.
Candidates
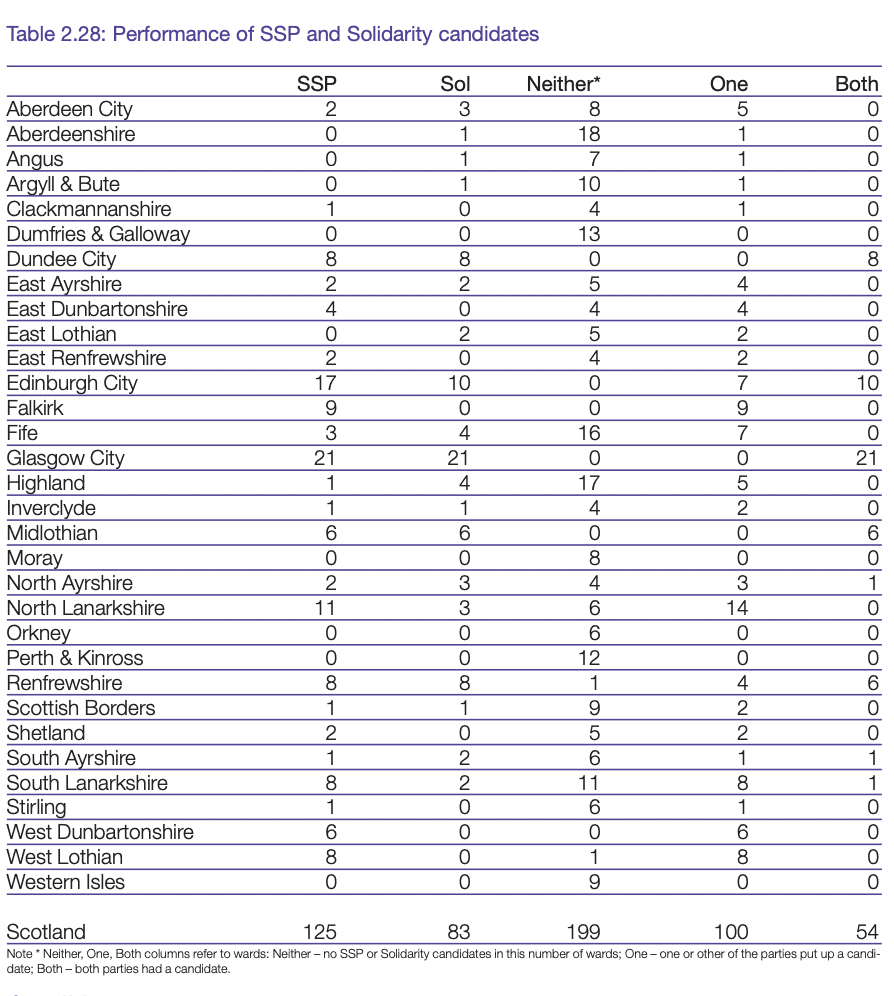
The pattern of candidates varied in different areas. Some had no socialist candidates at all (Dumfries & Galloway, Moray, Orkney, Perth & Kinross and Western Isles). In Dundee, Edinburgh, Glasgow and Midlothian, voters in every ward had a choice between SSP and Solidarity. These four councils accounted for the vast majority of the 54 wards where the parties fought each other. In other areas (such as North Lanarkshire) either different wards had gone different ways in the party split or a local deal had been done. Other branches of the former SSP seem to have gone entirely for one or other of the successor parties (the SSP in West Dunbartonshire and West Lothian, and Solidarity in most of Highland). There were 100 wards where one party but not the other stood. Overall, most wards in Scotland (199) had neither SSP nor Solidarity on the local ballot.
Results – votes
The 2007 elections were generally very poor for the two socialist parties. Compared to how the 2003 elections would have looked under STV, they ‘lost’ five seats in Glasgow. In most wards outside Glasgow (and a couple of other towns such as, perhaps surprisingly, Lerwick and Irvine) their share of the vote was almost negligible. Most of the few apparent gains came from increased availability of candidates rather than greater popularity. There was not a great deal to choose between the electoral fortunes of the two parties, save that in Glasgow Solidarity did rather better, helped by Tommy Sheridan’s nearly successful bid to retain his Scottish Parliament seat. The following table lists the 16 cases where an SSP or Solidarity candidate obtained 5 per cent or more of first preferences.
The combined socialist total in the Greater Pollok ward of Glasgow was 14.1 per cent, putting it in second, behind Leven, in its support for the small left-wing parties; Craigton’s combined total was 13.1 per cent. Pollok was the only ward in which a large socialist vote was split more or less evenly between two rival candidates, although in East Centre ward in Glasgow the combined vote was also relatively high at 9.7 per cent.
The socialist vote in 2007 was generally too small to put a candidate in contention for a seat, and would still be too small even if wards were electing more than 3–4 councillors. Most SSP or Solidarity candidates would need to get close to or over the quota to be elected because their parties do not attract many transfers. Ruth Black was, however, the beneficiary of 18.5 per cent of a large SNP surplus that had no SNP candidate to go to – although even so she was elected last, without having reached a quota.
The chances of a seat in Pollok were, however, wrecked by the party split and the extreme reluctance of supporters of the SSP and Solidarity to give the other party their second preferences. When SSP councillor Keith Baldassara was eliminated in the Pollok count, only 28.4 per cent of his votes transferred to Alice Sheridan of Solidarity. Nor was this a freak result of local circumstances – transfer rates of around 25 per cent between the two parties were typical. The bitterness between the parties’ leaders seems to be reflected among their voters. While a unified SSP would have been a significant force at least in Glasgow in the 2003 local elections, falling support and the split have relegated the far left to the fringes of Scottish politics.
Results – seats
Two candidates were elected from the socialist parties. A well established SSP councillor in West Dunbartonshire, Jim Bollan, was reelected in the Leven ward with an impressive vote, clearing the quota in a four-member ward and therefore winning before any votes were transferred. The Vale of Leven has long been known for its working-class socialist politics.
The other successful candidate was Ruth Black, who was elected for Solidarity in the Craigton ward in south-west Glasgow. Craigton and Pollok have a recent history of left-wing politics associated with Tommy Sheridan (elected in the areas as a Scottish Militant Labour candidate in 1992).
Some candidates elected as Independents, particularly in Fife, had decidedly left-wing politics (like Willie Clarke, formerly a Communist, who was elected with 95 per cent of the vote in Lochgelly in 2003 and easily passed the quota in The Lochs in 2007). However, the Fife left is separate from the warring SSP and Solidarity forces
Independents and Others
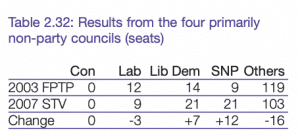
Non-party politics remains an important feature of the electoral landscape in rural Scotland. Table 2.31 summarises the performance of candidates not standing for the parties discussed already in this chapter, including Independents.
Two councils, Orkney and Shetland, no longer have any party political councillors, and another, Western Isles, is predominantly Independent. In another council, Highland, Independents are the largest single group but are no longer the dominant force they were before 2007. Moray is an unusual case in which Independents have recovered ground from the political parties since the first elections in 1995; although they are the biggest group on the council there is party competition in local elections.
In Dumfries & Galloway and Perth & Kinross Independents have largely been replaced by party politics, and there are signs that the same process is taking place in Aberdeenshire.
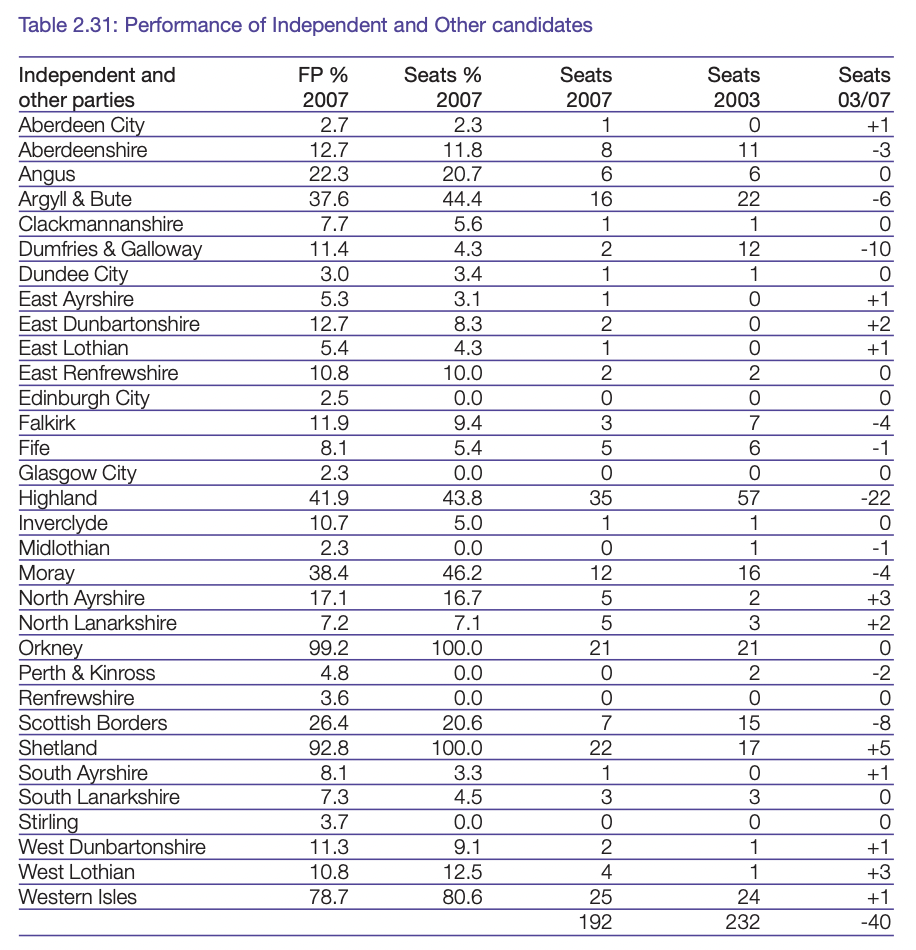
Overall, the STV election in 2007 continued a gradual process of attrition of the oldfashioned rural Independent which had been under way for some time. The move to multimember wards accelerated the pace of change in Highland as the political parties offered voters the option of choosing candidates with a party label and many Independents chose to step down in advance of the election. But the election also showed that the process is not inexorable, as results in Shetland and the Western Isles showed that there is some vitality in the traditional Independent model. Fears raised in advance of the election that STV would see the demise of Independent councils and councillors proved inaccurate. Taking the four councils with a primarily non-party mode of politics (thus impossible to model for what an STV result would have looked like in 2003), the change between the two elections even from FPTP to STV was relatively minor overall. However, this did mask considerable change in Highland, where the Liberal Democrats and the SNP leapt forward.
However, the traditional Independents are not the only model. Some Independents are strongly left wing, like the councillors elected in working-class Fife villages. Some again are disgruntled former members of political parties, whose personal popularity is enough to win them re-election – there are examples of this in East Renfrewshire and East Dunbartonshire.
In the 2007 election still another sort of candidate came forward, representing specifically local interests. The leading examples were Action to Save St John’s Hospital, which won three seats in West Lothian and helped the SNP into power, and the Borders Party whose two councillors make up a vocal opposition force in this rural council. Less successful was the East Kilbride Alliance. While these parties can arise under FPTP, as they have in England in places such as Wyre Forest and Castle Point, the 2007 STV election saw a definite trend in the hitherto party-dominated councils of Ayrshire and Dunbartonshire towards local and independent candidates. Just as the rise of the parties in Highland gave voters more choice, which many of them embraced, so has the challenge to the party dominance of urban Scotland that Independents in all shapes and sized present.
Chapter 3: Candidate strategy in multi-member wards
STV, unlike single-member FPTP, involves a political party making decisions about how many candidates to put up in each ward.
This calculation involves a number of factors, including the basic political sympathies of the ward, the personal reputations of the candidates, balancing a ticket by locality, sex or ethnicity, and the prevailing political climate in the country as a whole and in the particular local authority.
In the context of 2007, nominating more than one candidate was most associated with the Labour Party. Labour was traditionally the strongest party in Scotland, and also has particularly strong concentrations of support in urban central Scotland, while its main competitor, the SNP, has more evenly distributed support. Labour could therefore anticipate electing more teams of candidates than the other parties. Labour also came into the 2007 elections knowing that its inflated total of seats under FPTP was bound to be reduced, but with difficult decisions about sacrificing incumbents and allowing some new talent to come forward.
Multiple nominations and campaigning
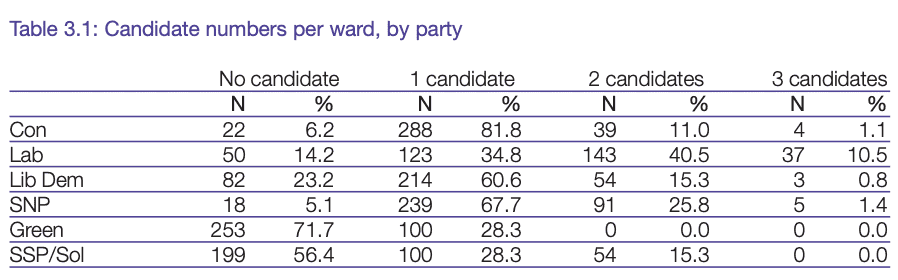
More than half of the wards in Scotland (51 per cent) had more than one Labour candidate, compared to only 12.1 per cent of wards with more than one Conservative, 16.1 per cent with more than one Liberal Democrat and 27.2 per cent with more than one SNP candidate
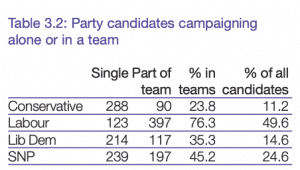
Looked at another way, 76.3 per cent of Labour candidates were part of a ‘team’ with other candidates in the same wards, compared to only 45.2 per cent of SNP candidates and even fewer for the other parties. Labour candidates accounted for nearly half of the total number of candidates who were part of a slate of more than one.
Labour therefore has the most experience coming out of the 2007 elections of the campaigning and management issues involved with running teams of candidates, and of instructing the voters about how to use several preferences to best effect. It is this political context which makes some of the questions that have arisen about ballot order so politically contentious. A ballot structure that assists a party in campaigning as a unit and highlights cases of multiple nomination may therefore be seen as particularly favouring Labour. Likewise, a ballot structure that disperses candidates from the same party around the paper, or makes it difficult for a party to indicate to its supporters how they could vote to help the party best, would be seen as particularly undermining Labour. The context of the next election may be different, in that there may be more multiple SNP candidates in urban central Scotland, but it is a consideration that is very likely to maintain a partisan tinge.
Over-nomination
Before the elections, party managers were often concerned about the risks of nominating too many candidates in a ward. If votes transferred completely along party lines, the party could not lose out from nominating more candidates than it could hope to elect, as is the case under STV in Malta. However, it is a consideration in Ireland because voters there do not stay within party lines and votes ‘leak’ away from the party whenever one of its candidate’s votes is transferred. In Scotland, the parties did not know how many voters would stick with them throughout their slate of candidates, and had little evidence to guide them because it was the first STV election since the 1920s. The boundaries were entirely different, making the parties reliant on guesswork about where their support might be.
Another worry was that party supporters would fail to transfer their votes effectively because they were unfamiliar with STV and might vote only for one candidate or, even worse, invalidate their ballot by trying to vote with multiple X votes. It was understandable that some took a cautious approach to nominations. The SNP in particular tended to aim low, sometimes putting up only candidates who were more or less certain to get in and not going for an ambitious seatmaximising strategy. An additional factor with the SNP was caution, having had hopes of good results dashed in several past elections, about whether their strong polling position during the campaign would last through to polling day.
However, the results showed that concerns about the risks of over-nomination had been grossly overrated. There was only one ward in the whole of Scotland, Doon Valley in East Ayrshire, where it looked as if the main reason a party (Labour) had lost out was because it had nominated too many candidates. Even then, over-nomination may not be the entire explanation for Labour electing only one councillor despite having 1.96 quotas’ worth of votes spread between three candidates. It strains possibility, but the Liberal Democrats’ performance in Inverclyde North (three candidates, 1.44 quotas, one elected) and Shetland South (two candidates, 0.76 quotas, none elected) might be held to be overnomination as well.
There were six wards where a three-member Labour slate polled a lower proportion of the vote than in Doon Valley and still managed to see two councillors elected. There was also a ward, Campsie & Kirkintilloch North in East Dunbartonshire, where two Labour candidates split 0.90 of a quota between them, but still managed to get one of them elected. The other parties all have cases in which the number of candidates nominated seemed far in excess of what the party’s vote share ended up justifying, but suffered no penalty for doing so.
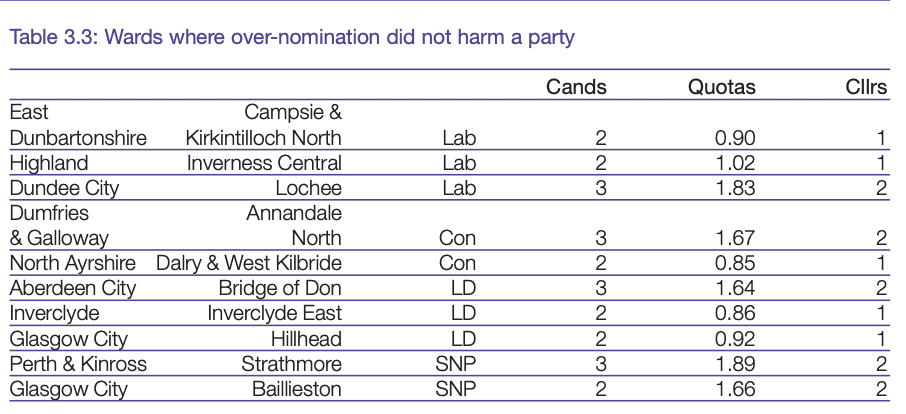
The extra campaigning vigour of a larger slate of candidates, with more people working the ward and the opportunity to put up candidates who appeal to different parts of the local community, may well have raised the party’s share of the vote in these wards rather than posing any sort of risk.
The basic principle of STV is that a party will get more or less the number of seats that its vote merits, and perhaps too much attention was paid to some of the technicalities in advance of the election. There turned out to be not much downside risk from running a generous number of candidates (Labour’s election strategy in Glasgow, where the party won a convincing majority, involved aiming high rather than low in many wards). If a party was to gratuitously scatter too many candidates across the field, it might suffer, but there seems every reason to round up rather than round down when considering how many candidates to nominate for the next local elections.
Under-nomination
Another principle, this time common to all elections, is that it is impossible to win seats where one is not putting up candidates. Under STV, a party can lose out because it has nominated too few candidates in a ward in which it has support to win more than one seat. In contrast to the risks of overnomination, which proved a lot less than expected, there were many cases in which a party received a vote that could have elected more candidates if they had been available. The SNP was particularly prone to this phenomenon, and might have won perhaps as many as 15 more seats across Scotland if it had put up some more candidates.
In every ward in which the SNP won more than 1.73 quotas, it elected more than one councillor – if the party had put up more than one candidate in the first place. Chances became better than evens at about 1.60. One can therefore name with something approaching certainty six wards in which the SNP lost a seat because insufficient candidates stood, and another five where it looks more likely than not.
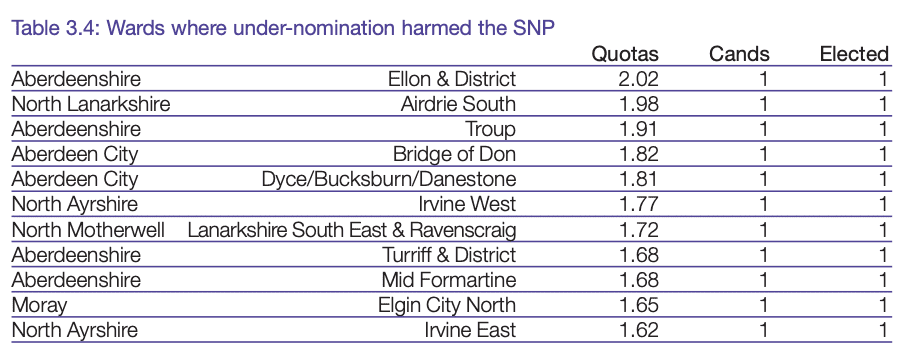
There were 19 more wards in which the party put up only a single candidate and won more than 1.42 quotas, i.e. the level at which the SNP won its first double-member representation. One of these was the Canal ward in the City of Glasgow, where a single SNP candidate polled 1.49 quotas. There were six other wards (Govan, Southside Central, Maryhill/Kelvin, North East, Greater Pollok and Craigton) in the city where a single SNP candidate polled more than 1.20 quotas, a reasonable indication that there was no danger of losing a seat through nominating two candidates and some prospect of challenging for a second seat. They may well have been able to benefit from transfers from supporters of the two socialist parties, who were more numerous in Glasgow than any other authority.
While the 2007 elections were very successful for the Glasgow SNP in some ways, as they elected every single candidate and now have representatives in all the city’s wards, they did miss several chances of electing more candidates because of their cautious nomination strategy.
However, this may reflect the fact that electoral strategy is not always purely seat-maximising: the SNP wanted to secure its foundations in 2007 with the hope of moving forward at the next elections. Trying to win directly, having previously had a group of only three councillors, would have been a stern test. Those with longer memories could recall that at previous SNP peaks in the late 1960s and late 1970s, the sudden election of a large group of inexperienced councillors of very mixed ability had not been in the long-term interests of the party.
The challenge is now to enable the selection of additional candidates in wards which already have an SNP incumbent. This will be difficult, because the incumbents will tend to see the new candidate as much as a threat as a helping hand: it is not uncommon for incumbents to lose to members of the same party in Ireland because voters want a different strand of politics within that party, or perhaps become dissatisfied with the incumbent’s services.
An additional problem is that the surpluses accruing to candidates in seats where the party has under-nominated tend to flow over to rival candidates whose political position is not too far away. In Glasgow, Green candidates in Canal and Southside Central benefited from SNP transfers. These councillors will become difficult to dislodge, particularly with a few years’ experience and network-building, and they may persuade SNP voters who gave them a second preference in 2007 to vote Green for their first preference in the next local elections. There is the cautionary tale of Dublin North, where Labour TD Sean Ryan was elected with 1.70 quotas in Labour’s 1992 surge. This would have been enough to elect another Labour TD, but Ryan’s surplus helped elect a Green instead. When Labour’s tide ebbed in 1997, Ryan lost his seat but the Green TD Trevor Sargent had established himself well enough to hold on. The SNP was not the only party to miss out through under-nomination. A single Conservative candidate in Kirriemuir & Dean ward of Angus council won 1.88 quotas. Rather more ambiguous were the cases of Girvan & South Carrick in South Ayrshire (1.49 quotas), and Bishopton & Bridge of Weir in Renfrewshire with 1.41 quotas. The lowest level of quotas that actually managed to elect two Conservative councillors was 1.63. In Hamilton South, South Lanarkshire, Labour had 2.41 quotas with two candidates, and in Coatbridge West in North Lanarkshire Labour had an amazing 2.67 quotas in a three-member seat, although the third seat in the circumstances of 2007 belonged to the SNP. In the Badenoch & Strathspey ward of Highland, a Liberal Democrat candidate won 1.56 quotas worth, which, given that the Liberal Democrats tend to attract transfers, may well have been enough to elect a running mate. However, it is not necessarily quite that simple. These single candidates who easily passed the quota may have been popular with the voters for personal reasons, and as a result those votes would not necessarily help another candidate of the same party – there could be high levels of leakage when that candidate’s votes are transferred during the count. It may not always be possible to realise the apparent gains from extra candidates in these circumstances. However, a party that knows the local electorate well could encourage its strong supporters to vote for the running mate, and rely on the well-known candidate’s personal appeal to balance up the votes for each candidate and help elect them both. Even if election with an excessively large surplus is because of a personal vote, there may thus be ways for a party to work with it to gain more seats.
Conclusion
The Electoral Reform Society produced a booklet before the election entitled Campaigning under the Single Transferable Vote, which was welcomed by councillors and campaigners of all parties. We look forward to revisiting those issues in the light of the experiences of real-life STV campaigning in Scotland in 2007 and the work of academic researchers who have examined the way the parties approached the tasks of campaigning under STV. The evidence from the 2007 elections showed that the risks of over-nomination had been greatly exaggerated and that the political parties, particularly but not only the SNP, had nominated insufficient numbers of candidates.
Chapter4: Representation of women, young people and minorities
In general, proportional systems are better at representing the different groups that make up society than majoritarian single-seat electoral systems. By electing several members at the same time, questions of whether a party’s slate of candidates is balanced or not will be unavoidable in a way that it is not for a series of separate single-member selections.
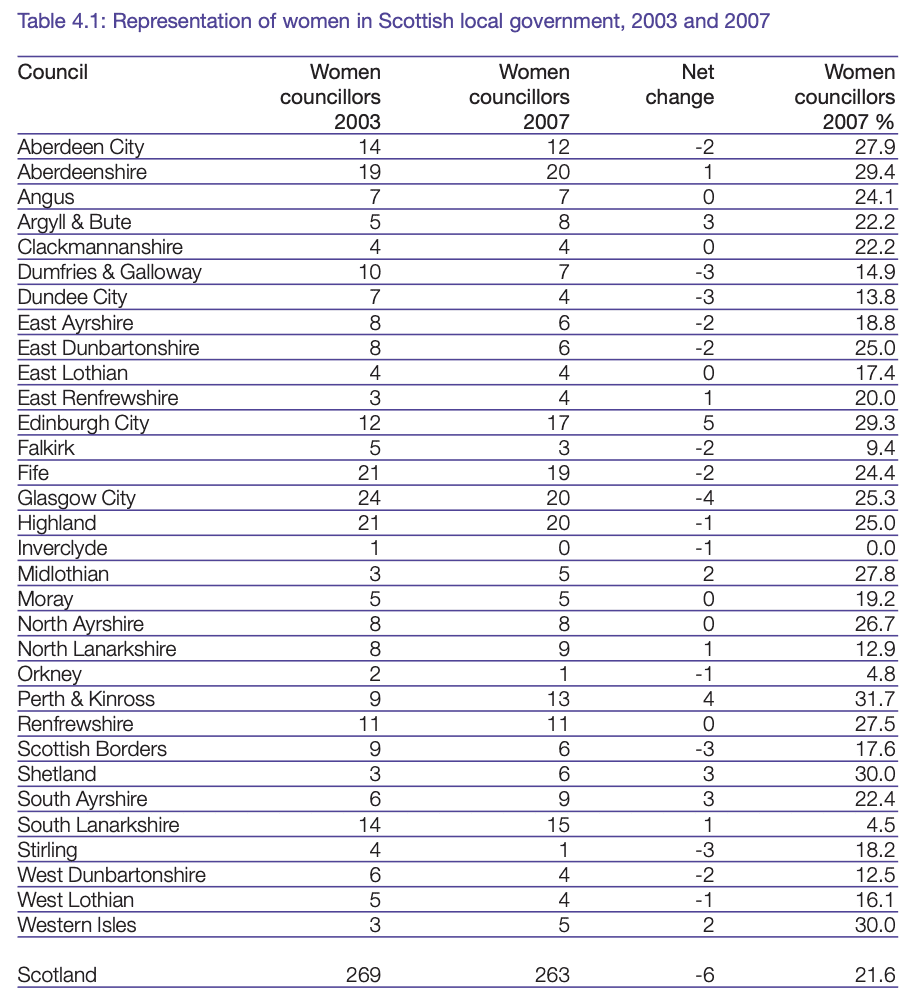
However, the Scottish elections were a cause of some concern for equality advocates for several reasons. The small number of councillors being elected for each ward meant that political parties would often choose to run only one candidate for that ward, reducing the positive effects of multi-member selections. The main party running multiple slates of candidates, Labour, was in a disadvantageous position because it had previously been overrepresented and there was a risk of senior (white male) incumbents having first choice of the party’s reduced number of seats and squeezing out women, young people and minorities.
Women
The outcome in terms of women’s representation in the 2007 elections is given in Table 4.2. The total proportion of Scottish councillors who are women was nearly unchanged, falling from 21.8 per cent to 21.6 per cent – or, in terms of numbers, 269 to 263.
With an overall fall of six in the number of female councillors, there were some variations between councils. Scotland’s two largest cities reflect this: Glasgow lost four women while Edinburgh gained five. In the Highlands and Islands too, the picture is mixed: Highland and Orkney councils saw a net loss of one woman each, while Western Isles (up two) and Shetland (up three) returned more women. Stirling is down three women, while neighbouring Perth & Kinross is up four.
Following the elections, there are six councils with women leaders out of 32 (18.8 per cent).
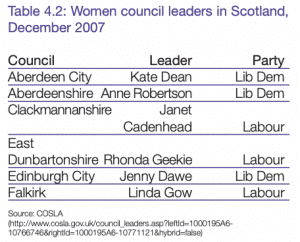
Scotland’s record at electing women candidates in local elections has been relatively poor over a long period, with the proportion essentially flatlining since 1995, in contrast to a rising trend in England.
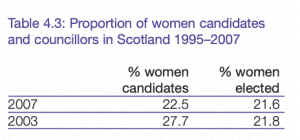
n 2003, there was a significant difference between the proportion of women standing and the proportion of women elected. This difference between the proportion of female candidates and female councillors can partly be explained by the fact that women are more likely to be put forward in unwinnable seats or as paper candidates, which does nothing to boost women’s representation.
In 2007, the two proportions were much closer. This means that women who made it onto the ballot paper in the 2003 FPTP election were less likely to be elected than men, while in 2007 women were elected at more or less the same rate as men, once they had been selected.
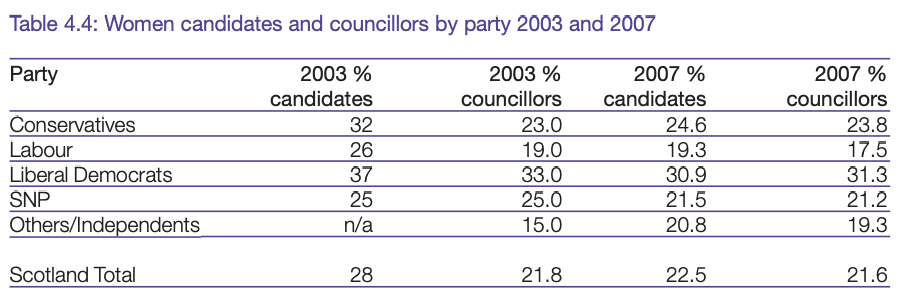
The relationship between candidates and councillors elected becomes even clearer if one can examine the cases in which a party nominated one or more than one candidate. The analysis below concentrates on the Labour Party as the party which stood about half of all the multi-member slates that were offered to voters in Scotland.
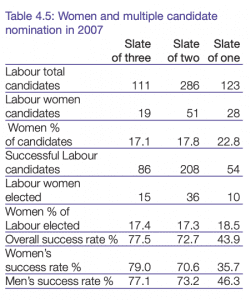
A party standing more than one candidate in a ward is obviously in a strong position and stands to elect at least one candidate unless something goes badly wrong. If any Labour candidates from the team failed, the electorate would be the ones deciding who won and who lost. Broadly, allowing for local factors, personalities and events on the campaign trail, men and women would have a more or less equal chance of being elected from these multi-member slates. This is borne out by the results, in which both men and women stood a very similar chance of election once they were nominated, and the proportion of women councillors was a close reflection of the proportion of women nominated.
The electoral position varied between different single-candidate wards. There were some such wards where Labour could feel confident of electing someone because the party had enough support to elect one candidate but not to seriously challenge for a second seat. This situation produces as near to a ‘safe’ seat for an individual candidate as possible in STV. On the other hand, there were wards where there was only a single Labour candidate because the party was showing the flag and did not have much chance of election, as well as marginals where the party might or might not win
Labour selected a higher proportion of women in wards where the party was only standing a single candidate than in multiple candidate seats. However, the success rate for women in these seats was markedly lower than that for men. This does suggest that men had a rather better deal in terms of the seats with single Labour nominations that were likely to return Labour candidates
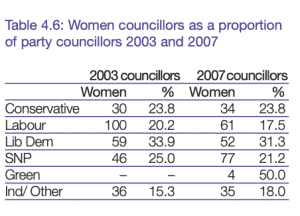
Overall, the proportion of Labour councillors who are women fell in this election, even slipping behind ‘Independents and Others’. As the party stood to lose councillors in this election, they did not do enough to make sure that women did not disproportionately lose out, despite pleas by the central party and advocates such as Margaret Curran MSP. The party may wish to look at the way selections were carried out in 2007 to see why it was that women formed a disproportionately high share of Labour’s vulnerable front line. However, the decline in Labour representation in 2007 means that the party can look forward to the next council elections as an opportunity both to increase the party’s overall number of seats and to do something about the poor representation of Labour women.
It is easier to expand representation of women when a party is gaining seats, because this does not involve the retirement or displacement of incumbents. The SNP, the principal gainers from the 2007 election, added a significant number of women and has the largest number of women councillors of any party. However, the proportion of SNP councillors who are women fell back. The two parties whose overall representation was little changed, the Liberal Democrats and Conservatives, saw little change to their share of women. Special mention should be made of the Green Party, which is painstaking about gender balance in its structures. Partly because of its own policies on nominations, partly through the pattern of its electoral performance, it ended up with 50:50 representation; two out of its five Glasgow councillors are women, as are two out of three in Edinburgh.
It is disappointing that parties did not select more women in 2007, and that an opportunity to make a significant improvement in gender balance in representation in Scottish local government was lost. Despite the effort to create a greater turnover of councillors by offering severance payments for retirees in 2007, incumbency remained a strong factor, particularly in the Labour Party, where more than 500 incumbents had to be squeezed into 380 seats even if there were no further losses.
Despite this, the number of women on Scottish councils remained stable in 2007. STV sets up incentives for parties to respond to the pressures from the electorate, and eliminates the ‘safe seat’ which has been a drag on changing the composition of councils. There will be a further opportunity for the parties in the ascendant in each local authority at the next elections in 2011 to make major improvements.
The new system has not disadvantaged women, although the opportunities it presents were far from fully grasped by the parties. If parties were to select greater numbers of women, then women’s representation on Scottish councils would increase.
Young people
There has long been concern, in Scotland and elsewhere, about the unrepresentative makeup of councils, in particular the preponderance of middle-aged and retired councillors. The Kerley working party and the previous Executive made recommendations and changes, including the new salary structure and severance payments, in order to promote change in Scottish local government. Before the elections, the average age of a councillor was 55 and there was only one councillor under the age of 30. A review of the situation in England, where there are many of the same problems, began in 2007.
STV and the other changes in Scottish local government created an opportunity for progress in terms of representing young people and, compared to the previous situation, there was a considerable improvement. With data from all 32 authorities, the number of councillors aged below 30 has risen to 28, of whom three were 18–21-year-olds taking advantage of the reduction in the age of candidature for these elections (in Aberdeen, Inverclyde and Moray). Youth representation in general is led by Moray, with 11.5 per cent of councillors under the age of 30, and Stirling and West Dunbartonshire following with 9.5 per cent and 9.1 per cent respectively. Moray was one of the most creative councils in appealing to local people to seek nomination in the run-up to the 2007 elections. Immediately following the local elections, there was a great deal of media attention on the SNP’s new leadership team in Aberdeen, with an 18-year-old Deputy Provost (John West) and another two councillors under 30 also with responsible positions. Giving these councillors leadership positions was a choice for the SNP’s council group in Aberdeen, but electing young people to the council was achieved under STV.
Black and minority ethnic (BME) representation
Scotland has a smaller proportion of BME residents than England; Scotland’s BME population stood at around 2.2 per cent in the 2001 census. The greatest concentration of the Scottish BME population is in Glasgow and to some extent its suburbs. In recent years East Renfrewshire has seen the largest percentage growth in BME population as residents move to the outer southern Glasgow suburbs. Elsewhere in Scotland there is a scattering of people from various ethnic communities throughout the country.
In terms of political representation, there is only a handful of BME councillors – 9 out of 1,222 councillors, or just below 1 per cent, elected in 2007. All were men of Asian heritage. Six of the nine councillors are Labour, two are SNP and one a Liberal Democrat. The proportion of councillors is less than the proportion of the Asian heritage population, and black, Chinese and other ethnic minority Scots were unrepresented. However, in any electoral system it is difficult to represent very scattered communities that form such a small proportion of the population.
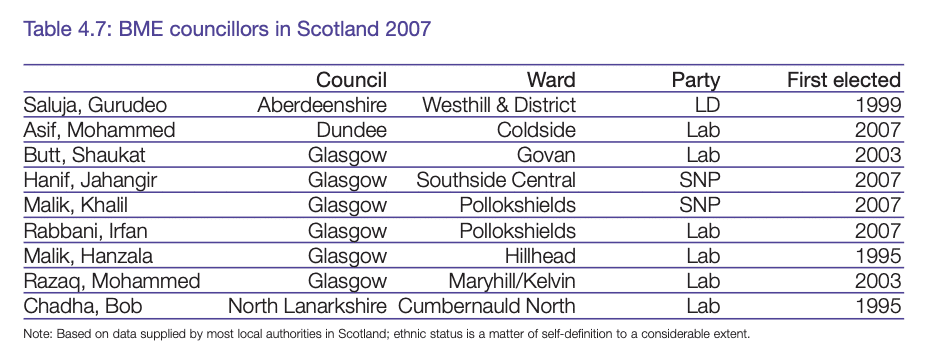
Six BME councillors were elected in Glasgow, 7.6 per cent of the council’s membership, which is acceptably representative given that the 2001 census recorded the city’s BME population at 5.4 per cent. Pollokshields ward on the south side, the heart of the Asian community in Glasgow, has two Asian councillors out of three. While four of the six Glasgow BME councillors represent areas with a substantial Asian population, two do not, and neither do the three councillors outside Glasgow.
In 2003 Glasgow had five BME councillors, so STV elections brought some progress. Bashir Ahmad, previously an SNP councillor in the city, won election to the Scottish Parliament on the regional list for Glasgow, becoming Scotland’s first BME MSP. Outside Glasgow, two councils lost their BME representation. In South Lanarkshire Labour Provost Mushtaq Ahmad did not stand for re-election, and in Edinburgh Labour councillor Shami Khan, first elected in 2003, lost his seat. Dundee gained a BME representative with the election of Mohammed Asif, leaving the total number in Scotland unchanged at nine.
The 2007 elections thus saw no net gain in terms of council numbers, but some progress nonetheless. In south Glasgow parties have a strong incentive to put forward a balanced slate of candidates in order to appeal to the diverse electorate there. In a year in which Labour, the party that has consistently returned the majority of Scotland’s BME councillors, did poorly, holding steady is a reasonable outcome for BME representation.
Conclusion
The STV elections for Scotland’s local authorities brought relatively little overall change to the representation of women and BME communities, but did see a considerable increase in the number of young people on Scotland’s councils (even though that remains a pretty small proportion of total council membership). The elections did not bear out the fears of some, that women and BME candidates would be squeezed out by the parties or face discriminatory voting on the part of the electorate. But, on the other hand, they did not achieve all that might have been expected by equality and electoral reform advocates either. In 2007 the voters showed that they were willing to give women, young people and ethnic minorities fair consideration – provided that they had the chance to do so. Making further progress will depend on changing the parties’ selection processes.
Part 2 Voters Experience
Chapter 5: More choice for voters
This section examines the extent to which the 2007 STV elections for local authorities delivered on the promises of electoral reformers to increase voter choice and give people a representative for whom they have voted, and whether the well-publicised problems with the May 2007 Scottish elections in general detracted from the benefits voters might have enjoyed from STV.
Were there more candidates?
The 2007 council elections saw a massive increase in the amount of choice available to Scottish voters.
In the 2003 elections 4,195 candidates stood in 1,222 wards. The average elector, therefore, had a choice from among 3.4 candidates (which was, incidentally, more than in most of England at the same elections). In 61 wards there was no competition at all, because a candidate was unopposed.
In 2007 there were 2,599 candidates for 353 multi-member wards. The choice available for the average elector was therefore 7.4 candidates – more than double the spread available in 2003 and far in excess of what was offered in England in 2007. There were no unopposed returns at all.
In the more rural authorities the extension of choice was dramatic – from an average of fewer than two candidates in Orkney and Shetland in 2003 to over seven in 2007. In these authorities, and in Highland and Western Isles, a larger total number of candidates stood in 2007 than in 2003, despite the reduction in the number of wards. In many of these areas, the real novelty of 2007 was having a contested election at all.
In the big cities there was also an extension of competition, with the big four parties often managing complete or nearly complete coverage (see Chapter 2). Electoral competition between the big parties in most of Scotland was strong in previous elections, but even so, the full range of major party choice was available to more people. While the total number of major party candidates fell sharply in Edinburgh and Glasgow, the number of Independent and minor party candidates rose because they would not be squeezed out by tactical voting any more and had a chance of winning seats because of STV’s proportionality. The average Glasgow voter could choose among nearly 10 candidates, and in Edinburgh the average was just over nine. In some local authorities there were candidates from smaller parties in every ward (Greens, SSP and Solidarity stood everywhere in Glasgow), and in many authorities smaller parties and independents were available to more voters.
There was more choice in every authority.
However, as some commentators such as Alistair Clark have pointed out, the extension of choice of candidate was accompanied by an increase in the number of candidates being elected. In a few wards, such as some in Ayrshire where there were four candidates for a three-member ward, the result – or at least for two out of three councillors – was predictable. However, the number of instances in which results were relatively pre-ordained in STV was tiny compared to FPTP in 2003, in which large swathes of Scotland, and many authorities, did not see real contests.
STV succeeded in broadening the range of choice to Scottish voters and opening up the electoral process to a greater range of candidates.

More voters are represented by their first choice candidate
The share of first preferences given to a successful candidate is only a rough and ready guide to how many voters got what they wanted in the election. Of those listed as not voting for a successful candidate, many will have given a second preference or otherwise indicated a level of approval for one of the successful candidates. In many wards where there seems to be a relatively low proportion of voters getting the person they voted for, there was an unsuccessful candidate of the same party as one of the winners, most of whose transfers will have flowed to the winning running mate. Voters for some smaller parties will be satisfied enough to have stated their real views with their first preference and then contributed to electing another candidate with their second preference.
The more candidates standing (i.e. the more choice for the voter), the more likely it is that the first preference votes will be spread between many candidates. More choice will tend to mean that the proportion of first preferences cast for winning candidates will fall – as seen in Edinburgh and Glasgow, where there was wide choice and below average proportions of first preferences going to the winners.
The proportion of satisfied voters (in the sense that they elect their first choice) is overstated in FPTP because of the restricted choice of candidate in each ward – for instance, in some urban seats the contest in 2003 was solely between Labour and the SNP. Supporters of other parties who chose between the two parties standing locally are counted as voting for the winner, but in a real sense this was not their first choice.
Even without taking into account all these factors, most of which tend to obscure the difference between FPTP and STV, the difference between the two systems is spectacular.
Fifty-two per cent of local voters in Scotland contributed to electing a winning candidate in 2003. Taking first preferences only, 74 per cent did in 2007. This means that three-quarters, rather than half, of the voters have a councillor for whom they voted – and this ignores all the second preferences from the remaining 26 per cent which contributed to electing councillors.
While most councillors and MPs try their best to represent all constituents, regardless of how they voted, there will be many cases where constituents will want to approach someone for whom they personally voted. STV means more people can do this than was ever possible under FPTP. Having voted for someone creates a more direct link between constituent and representative, and a greater sense of accountability and ownership, than being represented by someone whether one likes it or not.
The fact that so many more of the voters’ first choices are respected under STV is therefore a powerful blow against two arguments that are sometimes heard against the system.
First, it is clear that STV does not reduce elections to a lowest common denominator contest for second preferences – it is actually better than FPTP at representing people’s first choices, even with a wider range of candidates available.
Second, STV strengthens the link between constituent and councillor by giving a much larger proportion of people representation from someone for whom they voted.
Conclusion
STV in the Scottish local elections delivered increased choice and gave the great majority of voters their first choice representative – and an even greater majority could look at the election and feel they had contributed to electing a winning candidate. It was a triumphant success on both these criteria
Chapter 6: Transferable voting
This chapter examines a number of issues about transferable voting, including whether voters used their lower preferences, what determined how many preferences were used, and what effect transferred votes had on the results.
Did voters actually use preferential voting?
The evidence is clear that the vast majority of voters used STV in a fairly sophisticated way, and comparatively few used their first preference and went no further down their order of preference.
Some local authorities published a ‘preference summary table’ for each ward indicating the number of first, second, third and so on preferences given for each candidate. This allowed the calculation of the total number of voters in each ward, and therefore each authority, who used each successive preference.
In the two Ayrshire councils (and Shetland) there were cases in which there were only four or five candidates, which will artificially affect the total number of preferences (i.e. in a ward with five candidates, the ‘four preferences and no more’ total will be reduced and not mean anything distinct from ‘five or more’). Adjusting for these cases makes a fairly minor difference, and in all such cases the total proportion for three or more will be robust.
In all councils for which data is available so far, except South Ayrshire, the median voter used three preferences (i.e. marked valid first, second and third preferences on the ballot paper). This was pretty consistent across most wards within each local authority. In Glasgow, for instance, two relatively deprived three-member wards, Calton and Springburn, had a median of only two preferences and all the other wards had a median of three.
The finding that the median voter cast three preferences is an important one in the assessment of STV in Scotland.
This meant, in most wards, that at least one preference was cast across party lines, even in the hardest-fought councils such as West Lothian. The average voter was less willing to accept party as a limitation on choice than might have been expected on the first outing of STV.
Another striking aspect of the way preferences were used was in Highland and Shetland, where there had previously been a large number of uncontested seats in local elections and a multi-candidate election was unusual. In 2007, voters took to preferential voting with alacrity. In Shetland, where there were hardly any party candidates, an amazing 42 per cent of voters used four or more preferences, and in Highland it was 35 per cent.
Ward size and preference usage
Separating out ward results by the number of seats to be filled gives the following results.
Four-member wards therefore seem to be associated with a greater use of multiple preferences by voters, and this seems a relatively robust finding. Overall, around one in five voters used only a single preference – rather more in three-member wards, somewhat fewer in four-member wards
As might be expected given the relationship with multiple preferences, four-member wards also saw fewer voters choosing only one candidate than three-member wards. This reflects the greater propensity of parties to run more than one candidate in four-member wards, and therefore the flow of information to the voter about using preferences. The strong effect in the two Ayrshire councils (East mainly a Labour v. SNP contest, and South mainly Labour v. Conservative) supports this view. It does not provide support for the idea that wider choice produced confusion and a retreat into the certainties of a single preference or X vote.
However, the fact that the findings apply to nonparty contests in the Islands suggests that there is a link between using more preferences and four-member wards that goes beyond party.
Other factors
Without a detailed study, one can offer some propositions about preference usage that seem to be borne out by the data but which may be subject to challenge or revision.
Party nominations and activity
A factor influencing the extent to which voters used their preferences in Glasgow was the range of choice offered by the Labour Party, the most popular party in the city and – with the exceptions of the Liberal Democrats in Hillhead and the SNP in Baillieston – the only party offering more than one candidate in a ward.
Part of the reason will be that these will include some wards in which a party – nearly always Labour – will be running three candidates and producing material advocating the use of three preferences.
In wards with three Labour candidates, 60.4 per cent of voters in Glasgow and 61.2 per cent in East Ayrshire used three or more preferences. These proportions considerably exceed Labour’s actual share of the vote. The most likely explanation is that the multicandidate voters found everywhere to some extent (in widely ranging local circumstances there seem to be around 50 per cent who reliably marked three or more) were added to by Labour voters educated by Labour campaigns – and conceivably other voters made aware of the possibility by Labour asking for three preferences. Parties informing people about using preference voting for their
In the Pollokshields ward, where there was only one Labour candidate, 30.6 per cent of voters used only one preference, the largest proportion in the city.
This evidence suggests (without completely proving) that the Labour Party was broadly successful in informing its supporters across the city that they should cast their top preferences for all their candidates.
Social composition
It might be expected that the more educated and affluent the local electorate, the lower the proportion of first preference only voters and the higher the average number of preferences used.
This seems to be borne out to some extent. There were only two Glasgow wards (Govan and Shettleston) where just under a quarter of voters used more than three preferences, and these were among the more deprived parts of the city. In Hillhead ward in the West End around Glasgow University, nearly two in five (38.9 per cent) gave four or more preferences.
In Edinburgh the story was broadly similar, with the genteel Inverleith ward recording the highest proportion of voters casting four or more preferences (and the lowest proportion plumping). Other wards that were particularly enthusiastic about casting lots of preferences tended to be inner urban middle-class and student wards. Working-class areas like Forth and Liberton – and, perhaps less expectedly, settled middleclass suburbs such as Almond and Drum Brae in west Edinburgh – were less keen.
However, the social/educational pattern seems weaker than the effect of ward size, with the four-member and very working-class Sighthill ward having a larger proportion of people casting four or more preferences than the three-member middle-class suburb of Corstorphine.
The correlation of single-preference voting and rejected ballots seems a possible avenue for future research, as does establishing the relationship of both phenomena (separately and combined) with social, demographic and party nomination effects, once the three- or fourmember ward factor has been accounted for.
Why voters might use only one preference
There are several reasons why voters might do this, and separating out the different reasons is not really possible without access to the ballots and local knowledge of different areas. Among possible reasons are:
- The voter is a strong supporter of a political party that only put up one candidate in the ward, and only gave that candidate a preference. ‘Plumping’ might be because the voter genuinely does not feel the difference among the other candidates is important, or because he or she did not want to show any sign of support for such a candidate.
- The voter is a strong supporter of one particular candidate in the ward, perhaps an Independent, or has strong views about the differences between their party’s candidates in the ward. One striking case of this is Ward 4 (Campsie & Kirkintilloch North) of East Dunbartonshire where Independent Charles Kennedy received 2,609 first preferences, of which 1,031 had no lower preferences.
- The voter used a party or candidate’s ‘how to vote’ advice to guide their voting behaviour, even if their support was less than wholehearted. Party material, in cases where the party only offered one candidate, tended not to mention lower preference votes, and asked only for one preference.
- The voter felt unsure about using STV (particularly in combination with the election for the Scottish Parliament that was taking place concurrently and which generated confusion and spoilt ballots) and played safe by recording only one vote, for fear of invalidating his or her local government ballot.
- The voter has misunderstood the nature of STV, and been under the misapprehension that lower preferences could in some way harm their top choice.
- The voter has attempted to vote as if the local election were still a single-member FPTP election, and marked a single ‘X’ by their preferred candidate.
The tendency for single-preference usage to be greater in three-member than four-member wards suggests that the variation, at least, should be explained with reference to the first two factors (which are essentially political) and not so much the latter three (which stem from lack of information about the system – the third reason given has elements of both political choice and information deficit). Where the official ‘how to’ information produced by Vote Scotland and the local authority about using second and lower preferences was amplified by party materials advocating voting for the complete slate, more voters used their full set of options.
The strikingly low proportion of single-preference only votes in West Lothian may deserve further investigation. In part, this must be because of the pattern of party competition, with Labour and the SNP both being strong in the area with 36.6 per cent and 36.3 per cent of first preferences respectively. Slates of two Labour and two SNP ran against each other in six of the nine wards, and even in the three other wards one or other main party put up two candidates. People voting only for the SNP would have marked only one choice in nearly all of Glasgow, but two in nearly all of West Lothian. Electors in West Lothian therefore received frequent messages about voting for two candidates. This may explain why the proportion voting for only one candidate is so low, and voting for two (no less, no more) is so large. West Lothian council, additionally, may have done particularly well at informing voters that it was possible to use more than one preference.
Party activity cannot be the sole explanation for voters choosing to use multiple preferences, as the most enthusiastic users of third or lower preferences were the voters of Shetland (who also returned a particularly low proportion of rejected local government ballots).
Nevertheless, it is clear that a certain number of voters everywhere did fail to understand STV and either used a 1 only out of a lack of knowledge, or tried to vote FPTP style. As Richard Kerley has pointed out, one feature of STV in these elections was that voters could misunderstand how it worked and how they were supposed to vote, but still manage to record a valid vote. Nearly all mistakes with the single ballot AMS/MMP (Mixed Member Proportional, often known as Additional Member System in Scotland) Scottish Parliament election were fatal, in the sense that they invalidated the vote, and therefore the spoilage rate was driven up for that election but not for the STV local government polls.
While it is regrettable that any voters failed to make the most of their choices under STV, the fact remains that the system was robust enough to render valid those votes cast where the first preference intent was clear but where the vote was somewhat technically flawed or based on a misunderstanding of the ‘how to’ aspect of voting. Given that 74 per cent of first preferences were for winning candidates, even many people who cast only a first preference will feel satisfied with the outcome. The Scottish Parliament system proved to be less tolerant of human error.
An important conclusion is that the choice available to voters that comes from having four-member wards is not bought at the price of increasing confusion. By contrast, the greater choice seems to call forth a greater effort from the parties in particular to help voters to use the system to the best effect. There seems no reason not to think that this pattern may extend further and that fivemember wards are perfectly consistent with informed voter choice – perhaps even more so, paradoxically, than three-member wards.
Did transfers matter?
The overall picture Just over 60 per cent of Scotland’s councillors were elected thanks to transferred preferences from eliminated candidates or the surpluses of elected candidates. The rest had surpassed or equalled the quota at the first stage of the count and were therefore elected without the need to receive any transfers. Transfers were therefore highly important in determining the election results.
The differences between parties reflect their nomination strategies as well as the nature of the support they receive. The SNP was the only major party with a majority of councillors elected on the first stage of the count. This reflects the fact that its support in the elections was higher than expected, and its cautious approach to nominating more than one candidate per ward in authorities like Glasgow and Edinburgh. All Green councillors were elected through transfers. Liberal Democrats and Independents were the next most dependent on receiving transfers, with Conservatives and Labour in the middle.
In some authorities, the relatively low proportion of councillors elected with an initial quota reflects a successful nomination and vote management strategy, as in Glasgow where only 11 of the 45 Labour winners (24.4 per cent) had a full quota at the first stage. In others, it reflects a diverse pattern of local voting and a lot of candidate choice, as in the six authorities where fewer than 30 per cent of councillors had an initial quota (Angus, Argyll & Bute, Dumfries & Galloway, Edinburgh, Inverclyde, North Ayrshire). Four councils, mostly ones in which most individual wards, if not the whole authority, were polarised between two parties, had over half their councillors elected at the first stage (Aberdeen, Falkirk, Fife, Perth & Kinross; although Aberdeen’s result has more to do with SNP under-nomination or over-performance than polarisation).
Another aspect of the importance of preference transfers is to examine the cases in which the councillors elected were not the top three (or four) candidates when the first preferences were totalled. In such cases, one candidate further behind in the first stage of the count has overtaken one or more candidates to win election by the end of the count. There were 73 instances of this, (see Table 6.8).
The proportion of councillors who managed to climb the order of candidates during the count so that they were elected even though they did not start in the top three (or four, depending on how many members per ward) was rather limited at only 6 per cent. For 94 per cent of candidates elected, the redistribution of preferences did not appear to make any difference.
However, this is far from the whole story. Although 73 seats were involved out of 1,222 councillors, this was also 73 out of 353 wards, i.e. 20.7 per cent of ward contests involved transfers changing who was elected at the end of the count. In 29 out of the 32 local authorities, there was at least one ward in which a candidate overtook another during the count (the exceptions were Falkirk, Midlothian and South Ayrshire).
In terms of party fortunes, the redistribution of preferences clearly helped the Liberal Democrats. This might be expected from the party’s general political profile. Nevertheless, the extent to which the Liberal Democrats are dependent on receiving transfers is of significance for their next election campaign and how they might approach the task of representation in the intervening period.
While only very small proportions of Labour, Conservative and SNP councillors overcame first preference deficits by receiving transfers (the small Labour proportion is swollen by three cases in which the order of priority between Labour candidates was changed by transfers), nearly one Liberal Democrat in five owes his or her position to incoming transfers. Unlike other councillors elected in the same way, many of whom benefited from transfers originating with a running mate of the same party, these Liberal Democrats depend on transfers from across the political spectrum.
The Conservatives were the principal losers from redistribution of preferences. They failed to attract many transfers from other candidates. There were two main causes for this. First, cases in which more than one Conservative candidate stood in a ward were unusual. The main source of strong inward transfers of preferences that changed the order of candidates was eliminated candidates whose support transferred mostly to their party running mates, and then large surpluses generated by personally popular candidates which then flowed over to boost their colleagues. There were few wards in which the Conservatives could benefit from these effects and receive a strong in-house transfer.
The other reason was that supporters of other parties tended to have negative feelings towards the Conservatives, which translated into a lack of external transfers coming inwards from other voters. The same was true to some extent of Labour; the three major patterns of candidates overtaking others during the count were Liberal Democrats overtaking either Conservative (14 cases) or Labour (10 cases) candidates, and SNP overtaking Labour (8 cases).
It should not need saying, but there is no sense in which the candidates leading on the first count were in any way entitled to go on to win seats. That is not the way preferential voting works, nor the way in which the electorate used their votes on 3 May 2007 in the Scottish local elections.
Nevertheless, it might be asked what point preferential voting serves if the results are apparently so similar to a multi-member FPTP election, in which voters were allowed only one vote each. This would be to miss the point, however. The choice preferential voting offers to the electorate affects their voting behaviour, and thus the nomination and electoral strategies of the parties. To take the example of Glasgow’s ward 20 (Baillieston), the SNP candidate (McDonald) who started with only 250 first preferences but ended up elected was the running mate of another SNP candidate (Mason) who easily passed the quota. Had preferential voting not been in place, the Baillieston SNP would have tried harder to balance the votes of its two candidates. SNP supporters in Baillieston could vote for Mason confident that their vote would not be wasted if, as expected, Mason passed the quota with votes to spare. Similarly, in Perth City North (ward 11) Labour could run two candidates, giving the electorate more choice, and not suffer too much from a ‘split vote’. Without preferential voting, tactical voting will inevitably creep in.
The success of preferential voting in giving Scottish voters more choice and delivering a fairer result for the people, and the parties, does not depend on huge changes in the order of the candidates as the count progresses. The influence of preferential voting is ‘hard wired’ from the beginning and reflected in the election results in the way parties campaigned and people voted.
The next part of this chapter examines an individual ward result in which transfers played an important role in determining the outcome.
Did transfers matter?
A case study Paisley East & Ralston, Renfrewshire
The four-member ward of Paisley East & Ralston was one of the battlegrounds of the election in the closely fought council of Renfrewshire. For the most part, the new ward was composed of four old wards. Ralston was a safe Liberal Democrat ward although the incumbent councillor was standing down. Seedhill was held narrowly by Rayleen Kelly for Labour in 2003 over the SSP.
There were also two safe SNP wards, both of whose councillors were standing again – Brian Lawson in Gallowhill & Whitehaugh and Celia Lawson in Blackhall & Hawkhead. If these wards had been in place in 2007 it is unlikely that anyone would have been seriously contesting them, as they were three safe seats and the one marginal would have been rendered safe by the splintering of the SSP. The new STV ward presented more interesting possibilities. The Liberal Democrats could probably rely on a seat, although with a new candidate and new boundaries it was not to be taken for granted. Labour had a single seat, but were the second-largest party in the two SNP wards and stood a chance of gaining a second seat thanks to a reasonable vote across the whole ward; another Labour candidate, Jim Sharkey, was put forward alongside Kelly. The SNP were not guaranteed two seats and both candidates had incentives to work hard in the election, including in areas the SNP had not targeted before.
The quota was 1,468 votes, and therefore two candidates – Susan McDonald of the Liberal Democrats and Brian Lawson of the SNP – were elected at the first stage of the count with surpluses of 140 and 115 votes respectively. The next two candidates were both Labour, Rayleen Kelly narrowly ahead of Jim Sharkey. In terms of party votes, the SNP were ahead with 34.3 per cent of first preferences, Labour next with 27.9 per cent, then the Liberal Democrats with 21.9 per cent, Conservatives with 10.9 per cent and the two socialist parties with 5 per cent between them. The contest for the other three seats was between the two Labour candidates and the other SNP candidate, Celia Lawson, unless the Conservative candidate Alistair Campbell was extremely fortunate with transfers.
The Labour vote was extremely well balanced between the two candidates, perhaps reflecting a vote management strategy that if the party was to get the second seat in the ward it needed to keep both candidates in the count to attract any transfers that were coming in. However, Labour’s share of the vote was almost certainly too low on election day to get the second seat, even with such good vote management. However, if the party’s vote had been higher across the board in Scotland in general and Renfrewshire in particular, the strategy might have paid off.
The initial transfer of Liberal Democrat surplus votes eroded the thin lead enjoyed by Rayleen Kelly, the third-placed candidate when the first preferences were totalled. Her lead over her Labour colleague Jim Sharkey shrank from 21 votes to only 8, over Lawson of the SNP from 99 to 85 and over Campbell of the Conservatives from 235 to 208. There being no other Liberal Democrat candidate, the proportion of non-transferable votes was relatively high (28 per cent).
The next stage was the transfer of Brian Lawson’s surplus, which did have a fellow SNP candidate to go to. Of Lawson’s 115 vote surplus, just over 86 remained with the SNP (74.9 per cent). This remarkably strong transfer rate was assisted by the two SNP candidates being adjacent on the ballot paper and sharing a surname. Only 10 per cent of the vote was non-transferable, and around 15 per cent ‘leaked’ to other candidates. This caused a dramatic tightening of the gap between the three candidates at the top, so that Celia Lawson displaced Jim Sharkey from one of the top two spots. Kelly’s lead was down to only 2 over Lawson and 6 over Sharkey. The next stages would be the exclusion of the two socialist candidates, and unless there was a very strong and very improbable transfer from them to the Conservatives, the socialist votes would help determine which of the two Labour and one SNP candidate remaining would win.
The elimination of the two socialist candidates gave Celia Lawson another boost. When the SSP candidate’s votes were redistributed, she took the lead with a 5-vote margin over Kelly and an 8-vote margin over Sharkey. Solidarity transfers gave Lawson a 38-vote lead over Kelly, and Kelly a 1-vote lead over Sharkey. The decisive round would come with the elimination of the Conservative candidate.
The majority of votes in the Conservative column were non-transferable, as they found the choice between Labour and SNP an unpalatable one. Yet those voters who did make the choice made a decisive difference: 18 per cent of them went to Lawson of the SNP, giving her a clear lead over the Labour candidates and ensuring her election. The Conservative voters also expressed a preference for Jim Sharkey over Rayleen Kelly, boosting him into a 13-vote lead and also ensuring his election. Although no Conservative was elected, the Conservative voters who used their ability to rank preferences had a decisive effect on the election result.
During the count, from first to sixth stage, Kelly put on 133 votes through transfers, Sharkey put on 167 and Celia Lawson put on 353.
Even relatively small differences in the way preference votes are cast can affect who is elected in STV, and in this case the fact that Conservative and Liberal Democrat voters in particular liked Sharkey more than Kelly ended up getting him elected. Kelly may have suffered from being a high-profile incumbent and a strong Labour partisan. We shall see if future transfer patterns are as generous to Sharkey as they were in 2007.
Conclusion
The evidence from the Scottish local elections suggests that the great majority of voters understood how to use preferential voting. The majority took the option of casting lower preferences across party lines from their first preference candidate, which is a positive reflection of how thoroughly voters grasped the choices available under STV. While there were voters who used only one preference and some of those did so because they were unaware of how to use the system to the full, there were fewer than might have been anticipated given that the last multi-candidate ballot in Scotland had been in 1973. Instead of confusing people, four-member wards seem to be associated with a greater use of preferential voting by the electorate. This effect appears to be stronger than criteria such as social composition of the ward. Transferable voting is a key element of making STV a system that gives choice and fair representation, and allows voters to cast first preferences for their favourite candidate without having to worry about split votes and tactical considerations. While votes transferred during the count may have seemed not to change much, the fact that votes are transferable is central to making the system work to the benefit of the voter.
Chapter 7: Did people record valid votes?
Some critics have tried to argue that STV is somehow too complicated for voters to understand. The Scottish local authority elections were a stern test of how well the electorate could adjust to the introduction of STV, and how much they were able to cast valid and effective votes under the system. There were considerable difficulties in the transition, including:
- The STV local elections taking place on the same day as the Scottish Parliament elections, which use a completely different system (Mixed Member Proportional, known in Scotland as AMS), and the need for voters to comprehend both systems.
- A major redesign of the Scottish Parliament ballot paper, reversing what had been known in the previous two elections as ‘first’ and ‘second’ votes and placing both on a single ballot paper.
- The well-known problem of voter confusion regarding the Scottish Parliament ballot could well have led voters to become flustered or irritated and therefore disinclined to go on and record a valid local election vote.
- The main attention of the political parties being on the Scottish Parliament election in which voting with an X rather than 1, 2, 3 … is required – campaign messages centred around these concerns.
- The unfamiliarity of either multi-candidate seats or preference voting in public elections in Scotland, which might have led unwary voters to record an ‘X’ by the name of each candidate they support and thus invalidate their vote
With all these factors, it might have been expected that a very high rate of rejected votes (colloquially, ‘spoilage’) would be recorded in the STV count, particularly given the concurrent problems with the Scottish Parliament voting. However, the reality was very different. While there was an increase in spoilage in every authority except one (Scottish Borders), it was relatively modest in scale compared to the increased rejection rate for the Scottish Parliament. Rural areas tended to show smaller increases in rejection than urban areas.
The highest rates of rejected STV ballots were in the most deprived areas of urban Scotland, particularly the East End of Glasgow (4 per cent in Calton ward, with 4.2 per cent in Springburn ward being the only recorded case exceeding 4 per cent spoilage). While accidental spoilage is regrettable, the numbers involved in the STV election were not particularly large. The rates of rejected ballots in the Scottish local elections are very comparable – and indeed somewhat lower than – the rates found in Northern Ireland local authority elections. In 2001 and 2005, when local authority elections in Northern Ireland were held on the same day as the Westminster elections, the rates of rejected ballots were 2.41 per cent and 2.05 per cent respectively. When STV was introduced in Northern Ireland in 1973, on its own and accompanied by a strong public information campaign, the rates of spoilage were 1.7 per cent for the local elections and 2.4 per cent for the Assembly.
Rates of spoilage for the STV ballot were also considerably lower than in either part of the Scottish Parliament ballot, particularly the constituency vote, which was subject to an unprecedentedly high rate of spoilage, greatly in excess of what was recorded in 1999 or 2003. The following table compares several areas in which a comparison can be made between local and parliamentary voting.
Nor was the concurrent local government election under a new system an important cause of the high rates of rejection in the Parliament election. The Scottish Elections Review (Electoral Commission, 2007) conducted by Ron Gould concluded that:
… there is very little evidence to support the argument that the simultaneous local government election using STV contributed substantially to the higher rejection rates in the Scottish parliamentary election. (SER, p. 64)
And, further:
There was some cross-contamination of voting systems in the way voters marked their ballot papers but the degree to which this occurred was perhaps to be expected with the introduction of a very different voting system for the local election. So the problem of rejected ballot papers in the 2007 Scottish local government elections is less of a concern than in the parliamentary elections.
Gould also noted that cross-contamination (voters using the method of voting in one election to complete their ballot for the other election) may have inflated the rate of rejection for local government rather than for Parliament. Completing the Parliament ballot with ‘1, 2’ resulted in a valid vote if these were in different columns (candidate and party list), while completing the local government ballot with two X votes rendered it invalid.
Types of local government rejected ballot
The official legal categories of rejected ballot are of little assistance in determining the choices and errors made by the voters who cast that ballot – someone marking multiple X votes (anticipated to be a significant cause of spoilage) might have their ballot described as over-voting or void for uncertainty and categorisation was clearly not uniform. As part of the Scottish Elections Review conducted by Ron Gould, a sample of local government rejected ballots were examined to determine the underlying reasons.
The Gould research (SER, Appendix D, pp. 13–14) found that voters using ‘multiple unordered symbols only’ (i.e. multiple X votes and a few more peculiar variants) amounted to 76.5 per cent of rejected STV ballots they examined. The next largest category, accounting for 6 per cent of rejected ballots, was the use of a single number other than ‘1’, something which arguably did express a voter intent (particularly in those cases where the local government ballot was marked ‘3’ where it is quite possible that there were marks for 1 and 2 on the Parliament ballot). Other errors, including invalid sequences of numbers, were on a much smaller scale.
If future elections are to be de-coupled from Scottish Parliament elections (or, even better, preferential voting becomes the standard mode of voting) the misunderstanding that results in multiple X voting should diminish but probably not vanish entirely. It would also give the opportunity for more intensive public education work on how to vote under STV. The already fairly low level of spoilage in the STV election could well be squeezed even lower in future elections in Scotland.
The increase in party competition (no seats going uncontested) and the increase in turnout resulted in a general increase in the number of valid votes in the local government elections.
There were particularly large increases in valid votes cast in the most rural local authorities – Western Isles, Shetland, Orkney and Highland, where there were fewer uncontested elections and – in Highland – more political party candidates standing. There was a significant increase across nearly all of the authorities, urban and rural, and only three councils where there was a slight decline.
There were 177,817 more valid votes cast in the STV elections in 2007 than there were in the FPTP elections in 2003. This is a 9.5 per cent increase over the previous election.
The rate of ballot spoilage in the local government elections was considerably lower than in the parliamentary election.
The evidence suggests that Scottish voters found it relatively easy to cast a valid STV vote.
Conclusion
The STV local elections, contrary to some expectations, saw a much lower rate of rejected ballots than was observed in the Scottish Parliament elections on the same day; from this point of view rejected ballots were a relatively unproblematic aspect of the May 2007 elections in Scotland. While the rate – at 1.85 per cent – was higher than in past local government elections, it is comparable with the experience in Northern Ireland and not bad at all for a new electoral system. STV in Scottish local government has proved a robust electoral system and there is a strong case for adopting it to elect the Scottish Parliament
Part 3 Election issues
Chapter 8: Ballot design
The May 2007 elections were overshadowed by the large number of rejected ballots in the Scottish Parliament election, which the Gould review attributes mainly to the misguided redesign of the Scottish Parliament ballot paper. A single, two-column paper replaced the two separate ballot papers which had listed constituency and regional candidates in 1999 and 2003 (and still did in Wales in 2007). The matter quickly became a matter of partisan recrimination.
The local government ballot was largely free of these problems, and the issues we note in this section are of a much smaller order of importance than the problems that afflicted the Holyrood ballot, as spelt out in Chapter 7. However, it was not perfect and there are issues of ballot design to consider in a methodical fashion before the next set of local elections in Scotland.
Alphabetical order and the local government elections
Immediately after the election it was noted that there were some striking cases in which candidates of the same party attracted vastly different numbers of first preferences, and that many of these involved the candidate who was further up the ballot having more votes.
Some apparent examples of alphabetical bias are, on examination, not very convincing because there are alternative explanations for the alphabetically challenged candidate having fewer first preferences. For someone in that position to attract fewer first preferences, it is easier to blame ballot order than take a look at their own record and why that might have put voters off.
However, there is clearly a systematic effect caused by ballot order at work in the local elections. It is entirely implausible to attribute the observed pattern of alphabetic bias to chance. Research on how strong the effect is, and what factors contribute to weakening or strengthening it, should be part of the agenda for studying the May 2007 elections and should inform future discussions on possible changes to ballot order.
Ballot order effects can be observed in multimember FPTP elections such as London borough elections. Voters sometimes fail to use all three votes, or abandon their party for one or more of their votes, and it tends to be the third-listed candidate who suffers the most from this.
Preferential voting means that the potential for ballot order effects increases, because even voters who stick with the party for their highest preferences have to rank the candidates in order. A voter who is partisan, but does not regard the difference between the party’s candidates as being important, will tend to rank them in the easiest way, i.e. 1, 2, 3 from the top. In some areas party literature asked voters in different parts of the ward to use different orderings, to balance the party’s votes in the interests of effective vote management. The first named candidate, however, has a considerable advantage in attracting first preferences from party-oriented voters who will scan down the ballot paper and often give their first preference to the first candidate of their party that they identify. In elections in which a party puts forward more than one candidate and party supporters are relatively indifferent when choosing between its candidates, preferential voting does create a systematic advantage for candidates whose names begin with letters that come earlier in the alphabet.
It also seems clear from studying the transfer patterns in Scotland that order had a considerable effect on the extent to which voters used their preferences for fellow candidates of the same party. Candidates who were, for alphabetical reasons, adjacent on the ballot paper received a markedly better flow of transfers from colleagues and the flow deteriorates the further apart the candidates are (unless they are right at the bottom of the ballot paper). These findings will be spelt out in a future research paper dealing with transfer patterns in more detail. The easiest explanation for this observed pattern is that the higher rates of transfer to party colleagues when they happen to be grouped together reflect the wishes of voters to transfer within party when they are fully aware of the possibility. The greater leakage seen on ballot papers when candidates of the same party are separated can be most easily explained by lack of information – voters mark their second preferences unaware that there is another candidate of their party (those who subsequently notice this and change their votes might be a small contributory element to unclear and rejected ballots).
Ballot order has remained an issue which has been little discussed in British electoral administration (and when it did come up, in the run-up to May 2007, it generated more heat than light). Now would seem a good time to conduct a calm assessment of the options.
Ballot order options
1. Alphabetical by surname of candidate (as at present)
2. Each candidate listed in random order
3. Rotation, i.e. ballot paper design varied to prevent any candidate gaining any advantage from ballot placement
4. Candidates grouped by party on the ballot.
Alphabetical order
The advantages of alphabetical order are that it is a well-understood and neutral method of establishing an order, and that it is the default option being the one that is used in other UK elections. Alphabetical order may be procedurally fair, but in terms of outcomes it is systematically discriminatory and this is accentuated in multi-member elections conducted using preferential voting.
Random order
Random order replaces a systematic bias (which has long-term effects and can be manipulated for political gain) with a random bias involving votes for individual candidates and the rate of leakage during transfers. This would be an improvement. The Gould report into the 2007 Scottish elections recommended (p. 116) that for both local and parliamentary ballots a public lottery should be held to determine ballot order after close of nominations.
The procedure by which the random order is determined would need to take place in a fully transparent and trusted fashion to ensure that there are no allegations or perceptions of a biased outcome in which a favoured party is placed high on the ballot.
Random order may be a limited improvement, but it is worth asking if it is possible to do better and reduce the extent of random bias caused by ballot order.
Rotation
Rotation is a mechanism that prevents or reduces systematic or random bias in the results arising from ballot order. Different models of rotation are available. The very simplest would be to have two versions of a randomly ordered ballot, in which the order is precisely reversed on half the ballots (i.e. 50 per cent each would be ordered ABCDE and EDCBA). Another would be to rotate the identity of the candidate at the start of the ballot so that while they were in essentially the same order, there would be, say, five versions if there were five candidates (i.e. 20 per cent each for ABCDE, BCDEA, CDEAB, DEABC and EABCD). The full ‘Robson rotation’ version used in elections in Tasmania and Australian Capital Territory involves even more thorough mixing of candidates in which the order itself is varied. There are 60 permutations in fivemember ACT seats and 420 in seven-member seats. Every polling station will have a mixture of ballot papers, so that no candidate has an advantage from being prominently positioned in the ballot papers going to a strong ward.
Even full-scale Robson rotation is more technically feasible than it has ever been. The system of bar-coding ballot papers (rather than the previous need to make an official mark on a generically printed ballot paper) means that each Scottish local authority ballot paper is already a unique printed image, and if the barcode is varied on each, it would not be difficult to vary ballot order each time as well. While an election with a rotated ballot would be complicated and confusing to hand-count, it should pose no significant problems for an electronic count.
Although rotation is a feasible method, it is unlikely to be welcomed with open arms by election administrators already bruised by the excess of innovation in May 2007. It would introduce more stages of the process where ballot design or machine counting could go wrong, and it would make it virtually impossible to stage a last-resort hand count (particularly given the scale of fractional transfers under the WIG [Weighted Inclusive Gregory] method used in Scotland).
Rotation is also likely to run into opposition from the political parties. One of the claimed advantages for it in Australia is that it makes it impossible for parties to produce ‘how to vote’ advice featuring mocked-up ballot papers showing voters where to find the party’s candidates and (often) in which order to rank them. It is at least highly debatable as to whether preventing parties from advising their supporters how to use their votes to maximise the party’s performance and elect its strongest candidates is a positive development. The effect observed in Scotland, by which the rate of intra-party transfers is affected by how dispersed the candidates are on the ballot paper, suggests that a large body of voters want to vote a party line and would be impeded rather than empowered by rotation.
Party grouping
Party grouping on the ballot is in some ways the opposite of rotation in its effect on party campaigning. It too comes in several forms. If candidates are grouped by party there are several alternative ways of arranging the ballot paper.
Parties can be listed either in alphabetical order or randomly. In cases where there is only one candidate per party the second option would devolve to random order of candidates.
Candidates within each party group could be arranged in alphabetical order, randomly or according to an order as determined by the party for which they are standing.
This gives six possible combinations under the general heading of grouping by party.
Alphabetical order by party may suffer from a number of drawbacks. Although there is probably not that much advantage purely from being top of the ballot, and it is not clear whether it might work differently between parties and individual candidates, it may encourage parties to modify their descriptions to achieve this placing. Party designations in Scotland in any case are all rather similar, with most prefacing their standard name with the adjective ‘Scottish’. These issues arose in the ballot design in the regional list section of the Scottish Parliament election in May 2007 when the SNP chose to style itself ‘Alex Salmond for First Minister’. The Gould report recommended that ballot ordering methods should be changed to dissuade parties from adopting naming strategies to affect ballot order.
If there is a consistent ordering of parties at an election, it might – however unfairly – be seen as establishing a hierarchy of status between them. It may also seem to be establishing the primacy of party over candidate more than other grouped options, in that party identification becomes the main criterion determining ballot placement. The placement of Independent and non-party candidates also becomes problematic, as seen in the Scottish Parliament ballot, when they are relegated to the bottom of the paper.
Random ordering by party suffers from none of these issues, although once again there needs to be a decision process that is impeccably trustworthy to decide that order.
Grouping by party may encourage voters who come to the polling station intending to vote for a party to engage in comparison between the party’s candidates and reach a decision based on more than voting 1 for the first candidate that comes to their attention and then scanning further down the ballot (more or less efficiently) for colleagues. The difference between alphabetical and random order would presumably be less if that order was imposed on only two or three candidates rather than all those on the ballot paper.
However, there will remain a number of voters who are indifferent or uninformed about the individual qualities of the party’s candidates and who will tend to vote ‘donkey’ fashion from the top. One possible answer to this is that introduced for the Australian Senate in 1984, called ‘above the line’ voting. This allows the voter to simply tick a box on the ballot paper which means that their preferences are considered cast along the party’s specified order. This, however, was a response to the problems of electing 6 or 12 people on a very long ballot where casting large numbers of preferences was compulsory. It would be a drastic infringement of the candidate-centred choice in the smaller-sized wards in Scotland.
A more moderate proposal, countenanced in the Gould report (pp. 60–61) is to allow the party itself to determine the order in which its candidates will appear. Voters choosing simply along party lines will have the satisfaction of trying to elect their candidates in the party’s preferred order, but those wishing to make a different decision are perfectly entitled to do so and will not be swamped by party voting as they would be with ‘above the line’ voting. Voter choice remains central, rather than being by-passed as in Australian ‘above the line’ voting.
Consultation and testing
A problem in the run-up to the elections was the lack of trust and the partisan atmosphere that prevailed and extended even to issues as apparently technical as ballot design. Wrangling over the local government ballot was a contributory factor to the late availability of sample ballots. The assumptions of base political self-interest that surrounded the process did not lead to rational consideration of options such as random or party grouped ballot order. As soon as a proposal for grouping was floated in late 2006, it was instantly denounced by opposition parties as a ‘Labour fix’.
The Gould report notes that the consumer testing of both the Scottish Parliament and local government ballot designs prior to the 2007 elections was less than exhaustive. The combined parliamentary ballot paper is an object lesson in the unintended consequences of changes made for the best of reasons but without adequate forethought and testing. If local government ballot design is to be altered to try to make it easier for the voter to navigate his or her way through the paper and cast an informed vote (which one hopes would reduce ballot-order effects such as alphabetical bias), the least the Scottish Executive or any future Chief Returning Officer should do is test whether the redesign accomplishes the objectives.
While usability for the voter should be the main concern, any changes to the local government STV ballot should ideally be made on rational evidence-based criteria and also be the subject of political consensus.
Conclusion
It is not possible to argue that ballot order did not make a difference in some wards in the Scottish local government elections in 2007. While the effect on the overall party composition of authorities is likely to be very limited, it will have been more pronounced in cases where voters were choosing between candidates put forward by the same party. It is undeniable that there was an electoral advantage from being the first listed candidate of one’s party. Further, there was a greater degree of ‘leakage’ the further away from each other party running mates were listed on the ballot, suggesting that there were some voters who wished to cast second preferences for the same party but did not do so because of an information deficit generated by alphabetical ballot ordering.
To some extent, the issue of alphabetical ordering is about more than just a technical piece of ballot design. A causal factor in the phenomenon of alphabetical bias is voters’ indifference between candidates offered by the same party, which betokens a lack of knowledge about the characteristics of each candidate and a lack of interest in the institution that is being elected. A stronger role for local government, and better communications between councillors and candidates and the electorate, on both an official and political campaigning level, would reduce the indifference that gives rise to alphabetical voting.
However, this is not a complete answer; studies have shown that alphabetical order has had a long-term effect on the composition of the Irish Dáil, and in Australia, with its long history of preferential voting, adaptations such as randomisation, rotation and ‘above the line’ voting have been made to counteract its effects.
There is a strong case, as Gould indicates, for another look at how ballot design might improve voter choice and reduce the impact of extraneous factors like alphabetical order on election results, and such a review should be professional, rigorous and involve assessing what voters prefer and find easiest to use. In the end, choice of a ballot model should be made by professionals, and the Electoral Commission (or the Chief Returning Officer if that comes to pass) would seem the most suitable body to be given this responsibility
The Electoral Reform Society has analysed many of the possible options for ordering an STV ballot paper, and some of their advantages and disadvantages in this report, and will continue to look at the issues involved. The design of the ballot paper must aim to produce the most accurate picture possible of voters’ preferences – it is not a matter for political self-interest or blind adherence to a method such as alphabetical order which may well not be the best available. All the options need to be investigated and those considered worth pursuing should be rigorously tested with voters between now and the next elections, to demonstrate which form of ballot ordering the voters prefer and which generates the highest proportion of valid and meaningful preferences.
However, the issue of ballot order under STV needs to be brought into perspective: ballot design for the local elections was relatively unproblematic when compared to that for the Scottish Parliament elections in 2007. While there may be room for improvement, these issues should not detract from the success of the introduction of STV for local elections.
Chapter 9: Multi-member wards
As well as a new electoral system based on a new way of voting, there was another innovation in the Scottish local elections of 2007 – multi-member wards. How representation is working in the new wards is a question that is really for future analysis after more than a few months’ experience, but there are a few observations that can be made at this point, which follow directly below. Some of the more exclusively electoral aspects, such as drawing the boundaries and the properties of the three- and four-member pattern adopted in Scotland, are addressed in more detail here.
Multi-member representation
The local authorities that came into existence in 1975 were based on single-member electoral districts, in contrast to the usual pattern in the predecessor authorities of multimember wards. Other than in the Island authorities, however, the elector still had two councillors – one for the Regional council, one for the District. With the move to single-tier local government across Scotland in 1995, representation was reduced to only one councillor per elector.
Single-member representation had some advantages, particularly from the representative’s point of view. He or she was solely responsible for an identifiable patch of territory, and was the logical person to represent elected local government in relation to community groups, and to take local issues to the council on behalf of residents. However, single-channel monopoly representation did have drawbacks, quite aside from the inevitable result of single-member districts leading to unrepresentative council chambers. Coupled with a lack of effective electoral competition in many wards, there was no incentive – other than the elected member’s sense of civic responsibility and any pressure applied by a political party – to do the job effectively. The standard of representation was something of a postcode lottery. That most councillors worked hard in the interests of their constituents and took forward casework issues whether or not the elector had voted for them reflects credit on those representatives, but the fact remained that FPTP meant that the structures were not in place to guarantee standards or provide redress if things were going wrong.
In some rural and Island authorities, singlemember representation created something of a problem because potential candidates were often unwilling to come forward if that meant challenging a long-established and well-liked local councillor, which could lead to tensions within small communities. Multi-member representation removed this obstacle, in that people could offer themselves to the electorate (who benefited from more choice and the chance of change if they wanted it) without being directly confrontational to incumbents.
Multi-member wards are not a new invention; as noted, they have previously existed in Scotland and they exist in local authorities in most of England and Wales (using FPTP) and Northern Ireland and the Republic of Ireland (using STV). Although in England and Wales most wards elect representatives from only one party, there is still a very significant minority in which party representation in the ward is split (particularly when the three seats for a ward are elected one at a time in three election years, as in the metropolitan boroughs).
It is too soon to come to definitive conclusions about the impact of multi-member wards (and sharing responsibilities between councillors of different parties) in practice. How councillors and electors respond to the cultural change of multi-member representation will be a major subject of research and discussion in the next few years.
However, it is possible to make a few initial observations and suggest scenarios for different patterns of ward representation. Relations between fellow councillors of different parties will lie somewhere along a spectrum between overt collaboration as the representative team for the ward, and hostile competitive relationships.
The situation most conducive to collaboration seems likely to be in a mixed three-member ward where there is one councillor from each of three of the four major parties, significant support for all four and not much chance of any party winning a second seat. Incumbent councillors have an incentive to collaborate to keep the fourth party out in the next election.
Competition may be greatest when there is a four-member ward, with three members from one party and one from another. The minority party will be seeking to make further progress at the expense of the major party, while the major party may want to freeze the minor party out.
These incentives will of course be affected by the political complexion of the council and its executive and personal relations between individuals.
The relationships between elected representatives, and between those representatives and the electorate, will be fruitful areas for further research.
Different councils have responded in different ways to the challenge of providing member services, casework support and liaison with community councils and local organisations, and this again is an area in which study and sharing of good practice will no doubt emerge.
The ward boundary review
The legislation introducing STV for Scottish local government contained a number of factors which constrained the way in which boundaries were drawn. The Kerley working party on local democracy in 2002, and the Executive’s STV Working Group, recommended having two to five members per ward, which would have meant greater flexibility, but Parliament legislated to set the number of councillors per ward at three or four.
The number of councillors per authority was also to remain unchanged. This was also at variance with the Kerley recommendations, which suggested that no council should have fewer than 19 members or, with the exception of Highland, more than 53. Keeping numbers of councillors constant meant that two councils (Clackmannanshire and Midlothian) remained below 19 members, and several (Aberdeenshire, Edinburgh, Fife, Glasgow, North Lanarkshire and South Lanarkshire as well as Highland) exceeded 53.
The ward boundaries themselves were mostly based on local authorities’ own definitions of geographical communities, which were then aggregated into wards; this was a more sophisticated approach than simply aggregating existing wards. The Local Government Boundary Commission for Scotland employed GIS (geographic information system) software and undertook possibly the most technically accomplished boundary review yet to take place in Britain.
Some FPTP wards in 2003 contained small parts of different communities that were a consequence of the need to divide councils into single-member wards of nearly equal electorate size. Falkirk, for instance, had several wards that were poor matches to community boundaries. Ward 29 (Redding & Westquarter) comprised three areas which, while technically contiguous, were impossible to travel between without a lengthy detour outside the ward. Several other wards in Falkirk, and others in councils such as Perth & Kinross and West Lothian, also had a very tenuous relationship to local community ties. This was noted by the Kerley working party on local democracy in 2002:
The recent Boundary Commission review of ward boundaries caused friction in situations where the requirement to equalise the numerical size of wards (and hence the weight of the individual vote) tended to produce highly artificial boundary lines. The larger ward units which would be required under AMS or STV reduce the number of lines to be drawn on the map, and to that extent reduce the risk that communities would be split, or that areas which feel no common community will be put together. However, we have already noted the difficulties that would arise from the creation of very large wards in sparsely populated areas.
However, the fit between the new STV ward boundaries and community ties did depend on the quality of the analysis of local communities that was provided to the Local Government Boundary Commission for Scotland. There were also several hard cases in which it proved impossible to draw three- and four-member wards that fitted well with commonly observed community boundaries, such as Glenrothes in Fife, which had to be divided between several wards mixing urban and outlying areas rather than being a single large ward. The Highlands and Islands also posed particular issues in reconciling community boundaries with the need for equal representation and the threeand four-member template. The Local Government Boundary Commission for Scotland found Highland a particularly difficult case and ended up adopting a second-best scheme, noting that:
Had we not been precluded from making recommendations for 5-member wards the issues around Badenoch, Strathspey and Nairn could have been readily resolved. (Fourth Statutory Review of Highland, para. 35, Report to Scottish Ministers, August 2006)
In some Island authorities, islands were split and grouped in sometimes peculiar ways.
The decision to keep the number of councillors in each authority unchanged was also a constraint, particularly in authorities with small memberships such as Midlothian (18) and Clackmannanshire (18). Scottish local authorities other than the cities have tended to have small memberships, with the previous Nairn district having only 10 members. But in some cases, the match-up with community boundaries and the representativeness of the result might have been improved if the Local Government Boundary Commission had been allowed to vary the numbers of councillors on each council.
However, the limited flexibility of having three or four members per ward, and the ability to start with small units of communities, meant that the new wards in many cases were more rational than those they replaced.
Three- and four-member wards
A pattern of three or four members, as in Scottish local government, lies at the lowest end of district magnitude in international experience with STV. Different councils have different balances between the alternative ward sizes, with the highest proportion elected from four-member wards in Glasgow (81 per cent), followed by North Ayrshire and South Ayrshire (80 per cent each).
Two local authorities, East Dunbartonshire and Midlothian, had uniform patterns consisting of three-member wards. Each council had a small existing membership, with Midlothian having only 18 councillors and East Dunbartonshire 24. In neither council, particularly Midlothian, were the boundaries all that close to community identity. In Midlothian Dalkeith, Penicuik and Roslin were all divided between wards, but it proved impossible to devise a satisfactory match-up between boundaries and communities whatever pattern of wards was used as long as the 18-member total was preserved.
Small wards led to results in which party representation was rather disproportional; it was ward size, rather than the small numbers of councillors, that seemed to be the main cause of disproportionality. In another small council, Clackmannanshire, there was a reasonably proportional result using three four-member wards and two three-member wards.
In both cases, an increase in the number of seats per ward, even if only to four per ward, would have made a considerable improvement to overall proportionality.
While it is clear that three members is insufficient for proportionality except in a very broad sense, the gains from increasing seats per ward from a uniform 3–4 to a uniform 4–5 seem to be rather smaller, at least in the politically plural environments of Edinburgh and Glasgow. The following model adds an extra seat to each ward. This is not a perfect model of a larger district magnitude, because it distorts the number of electors per councillor; a larger ward now has 1.33 times the electorate of a smaller one as before, but only 1.20 times more representation.
The deviation from proportionality between the larger parties does seem to be reduced with larger seats; as a general principle the more seats there are available, the more closely the results approximate proportionality. This is why FPTP and AV, with one seat, are not proportional while even 3–4-seat STV in Scotland gives a surprisingly good degree of proportionality and six-seat STV in Northern Ireland is quite precise. The effect of a move from 3–4 to 4–5 in the Scottish context would be strongest for the smaller parties because the barriers to entry are lowered. However, large ward size still seems to be compatible with a large DV measure of disproportionality, with the council with the most four-member wards (Glasgow) also having one of the most disproportional overall results, which would be little changed by adding an extra seat to each ward.
No doubt patterns of contesting seats and campaigning, and hence votes, would themselves be affected by the number of seats available in each ward (in the Glasgow example I have assumed, as in Midlothian, that the SNP would run a few more candidates). Smaller parties, for instance, might fight more vigorous campaigns inspired by the greater chance of success in a five-member ward.
Some evidence for this is found by looking at the patterns of contestation in three- and four member wards.
Four-member wards tended therefore to have a wider choice of candidates, but the rise was less than commensurate with the increase in the number of seats available – particularly for the four major political parties. While locally strong political parties might put up an extra candidate in a four-member ward compared to a three-member one, only one or at most two parties would be in this position. Therefore, one might well have four candidates from the main parties for a three-member ward (1.33 candidates per seat), there might be five for a four-member ward (1.25 per seat).
Four-member wards did seem to be associated with more open political competition beyond the four main parties. The average number of small party and Independent candidates contesting a threemember ward was 2.41, and in a fourmember ward 3.07. This relationship is complicated by systematic differences in ward size. In mainly rural authorities four-member wards tend to be concentrated in the more urban centres and sparsely populated areas have three-member wards for obvious reasons of making wards geographically manageable. The most rural areas in which Independents are traditionally strongest will therefore have three members, and urban areas with some history of party competition will have four. In the four most rural authorities (Highland, Orkney, Shetland, Western Isles) the proportion of candidates coming from major parties rises from 25.5 per cent in three-member wards to 37.8 per cent in fourmember wards, largely because there was so little party competition in any of the Island authorities. In some central belt authorities three-member wards are used in some of the more self-contained outlying communities in which Independent politics has maintained a foothold, such as Armadale (West Lothian) and Renfrew (Renfrewshire). The core towns in many councils are associated with fourmember wards (as with Irvine in North Ayrshire, Falkirk town and Ayr in South Ayrshire). In Glasgow, the three-member wards are disproportionately drawn from areas of relative weakness for Labour, causing more Labour candidates to appear in fourmember wards. Electoral system effects may be counteracted by political factors such as these, which affect the supply of independent and major party candidates. This noted, there does seem to be a pattern of greater electoral competition from small party and Independent candidates in four-member wards.
In terms of actually electing candidates, as opposed to standing, all but one minor party (as opposed to Independent) councillor has been elected from a four-member ward. The exception is a Borders Party councillor from Leaderdale & Melrose ward on the Scottish Borders council. Green councillors in Glasgow and Edinburgh were all elected from fourmember wards.
Conclusion – the electoral mechanics of multi-member wards
The local government boundary review, although professional and effective, was forced to work under two constraints that sometimes made for unsatisfactory outcomes. One was the determination to maintain the number of councillors on each council exactly as it was, which went against the Kerley recommendations on size. More flexibility could have produced more equitable results and better representation in some areas such as Midlothian. Another constraint was the absolute insistence that only three or four members would be acceptable numbers per ward, which produced some wards in areas like Glenrothes, Johnstone and the Islands that did not accurately reflect the way people thought about community identity. Greater flexibility for the Local Government Boundary Commission in creating, say, two- and fivemember wards where the local physical or social geography demanded it would have mitigated some of these hard cases.
The three- and four-member ward pattern also set a high threshold for smaller parties. The fact that only one minor party councillor was elected in any three-member ward anywhere suggests that the high barriers to entry into political competition in three-member wards have a stifling effect on the smaller parties. While the main argument for allowing more flexibility is to better reflect community boundaries and, where three members fit well it would be inappropriate to tear up the pattern of representation simply to let in minor parties, it does suggest that a presumption for more four-member wards and the existence of the occasional five-member ward would have a healthy effect on local political competition. While increasing the size of wards helps to lower the barriers to representation for smaller parties, by itself it is not the most effective way to achieve more equitable representation between larger parties – for that, there is some evidence that a mixed pattern of different sized wards achieves the best results, although this is an issue for further research.
There is certainly no case for a general review of ward boundaries before the next set of local elections, and very little appetite for the disruption of relationships between communities and representatives that would involve. If, however, there are interim reviews of particular authorities because existing arrangements turn out to be unsatisfactory in practice, or because of exceptional population changes, these might provide an opportunity for piecemeal change. The next general review, whenever that comes, would benefit from being allowed a bit more flexibility in ward arrangements and should be encouraged to produce a ward pattern that allows strong community representation, proportionality between the main parties and a pluralistic environment for smaller parties and popular Independents.
Part 4 Looking ahead
Chapter 10: Looking forward
Local representation and governance
On 3 May 2007, Scotland made a transforming and progressive change to the way it is governed by electing local authorities using the Single Transferable Vote. But, a bit like devolution itself, fairer representation in local government is a process as well as an event. The consequences of reforming local elections will work through the system, unlocking further opportunities for bringing councils closer to their electorates and giving people fairer and better representation. While election day 2007 was, in this respect at least, a triumph, the true impact of the change can only be fully appreciated later.
There will be a great deal of academic, political and journalistic research to do in the years ahead, and the Electoral Reform Society will play its full part in this work, publishing research and convening seminars and conferences where experiences can be shared.
The ERS intends to be involved in regular monitoring of how councillors and electors feel about the new system, particularly the changes in the way representation takes place in multimember wards. Anecdotally, it seems that electors have started to use the competitive relationships between councillors to obtain the best service as constituents, which may present new challenges for the councillor but certainly puts the voter first.
We have only briefly addressed the important issues concerning the representativeness of the election results in terms of the position of women, young people and ethnic minorities on Scotland’s councils. It will be important to monitor how these and other groups in society, such as working people, local businesses and professionals, find they are able to make their voices heard within the new system. While in general proportional systems are better for diversity of representation, this requires positive action by the parties and the local authorities (the move to a salaried structure in 2007 is part of the picture).
The kaleidoscopic pattern of coalition formation between the parties in Scotland, and the profusion of informal arrangements by which power can be more widely shared (even in councils which still have a majority), are a rich field for analysis. Relationships between elected local government administrations, minority councillors, electors, council officers and the ‘national local government’ relationships involving COSLA (Convention of Scottish Local Authorities) and the Scottish Executive and Parliament will all change.
The electoral system
Although attention must move to the ultimate results, in terms of representation and governance there are still some important issues to consider about the electoral system itself before the next elections come round.
When exactly that will be is itself one of the issues. Following the Gould report and the announced policy of the Scottish Executive, it seems inevitable that the local elections will indeed be deferred so that they can be decoupled from the Scottish Parliament elections in May 2011. The most likely option appears to be a year’s delay to May 2012.
De-coupling the elections provides several opportunities, as well as the danger that the next set of elections may see a lower turnout than in the past because of the greater interest in Scottish Parliament rather than local government elections.
The local elections will have more of a chance of being fought on local issues, and this will perhaps result in even more voters using the sophisticated sorts of choice that are possible under STV to distinguish between candidates of the same party and indicate what sort of administration they would like to see in the civic centre.
The level of media attention to the fact that elections are taking place will be lower, and this probably means that the Scottish Executive will have to mount a strong public information campaign alerting people to the fact that local elections are taking place and the important ways in which local government decisions affect people’s lives. ‘How to’ information about the system will also be necessary, although next time it will be able to focus exclusively on how to get the best from STV rather than explaining two fundamentally different methods of voting as in 2007. The 2007 results showed that voters generally do grasp how to use STV, and there is every reason to expect the next elections to produce another successful experience of STV, with perhaps fewer single preference votes and even fewer rejected ballots.
Public information does not stop simply at the close of poll. Reporting the results is itself an important contribution to the democratic process, and here the standards of local authority and media performance in 2007 were extremely varied. Some local authorities were truly excellent at providing information promptly and completely: Glasgow was by some distance the best in Scotland in this respect, although West Lothian and Renfrewshire also deserve commendation. Other authorities provided information late and without proper details, although in some cases there were IT problems behind this failure and it must be acknowledged that the 2007 electoral process was particularly fraught for administrators. Some authorities’ websites (South Lanarkshire, South Ayrshire and Dundee come to mind) gave little or nothing more than the names of elected councillors for each ward until several weeks after the poll. Particularly with a new electoral system, and one that sometimes involves councillors being elected with fewer first preference votes than unsuccessful rivals, some thought needs to be given to presenting results in a clear, comprehensible and timely way.
After the confusing experience of the combined elections of 2007, and in the light of the ballot order effects that were apparent, a calm and rational examination of different possibilities for ordering the ballot should take place comfortably before the next local election day. This report has offered several alternatives and these can be studied and consumer tested, and an outcome agreed, before 2012.
Except perhaps in one or two special cases, one should not expect any alterations to the boundaries or numbers of councillors elected to each ward before 2012, although in the longer term greater flexibility with the number of councillors per ward and the number of councillors on each local authority would be desirable. This is the case whether the existing 32-council local government template is retained or reformed to reduce the number of authorities.
Something to look forward to
The problems of election day 2007 have been much discussed, but for local government a revolutionary change passed off quietly and successfully. Council chambers across Scotland are more representative of their voters than they have ever been. The second term of the Scottish Parliament left this fine legacy upon which its successors can now build. A new and fairer way of representing people will, we hope, lead in turn to a refreshed and revitalised local government system in Scotland that leads further innovation and change. Scotland has often shown itself to be a leader in public policy, and we hope that the local government reform that took effect in 2007 will be emulated in other parts of the United Kingdom and the world.
Appendix Scotland’s 32 new councils
First Preference Votes, Seats and Historic Results
Full results for all 32 Scottish councils are available in the appendix of the PDF report.