Introduction
An unusual election
The 2010 election saw a number of unique and interesting features of the campaign and the result.
Leader debates
The 2010 campaign was the first to feature direct, head-to-head televised debates between the leaders of the three largest UK parties. These debates changed the nature of the campaign and inspired considerable public interest in the campaign.
A hung parliament
The 2010 election was the first since February 1974 to produce no overall majority for any party (although there were hung parliaments in 1976-79 and intermittently in 1994-97 as government majorities were whittled away).
House of Commons majorities have become the norm and indeed this pattern is used as an argument in favour of the FPTP electoral system.
However, the lack of an overall majority for any party among the people who voted is nothing new – there has not been a majority mandate for any party since 1935, with the arguable exception of 1955.
A transfer of power
The election was also relatively unusual in producing a transfer of power. The previous occasion was of course Labour’s win in 1997; but apart from the turbulent 1970s, which produced three switches of power, there have only been two other occasions since the end of the war – 1951 and 1964. Even then, 2010 came tantalisingly close to an outcome where
a reconfiguration of the government as a Labour-led coalition, rather than a full transfer of power, might have been possible: Labour fell a few seats short of this possibility.
While causing a power shift, the 2010 election confirmed another surprising fact about British government – that the classical picture of
a majority government of one party cleanly replacing a majority of the other main party (the basis of the argument that FPTP enables voters to kick out a government) is a rare event. Since the mass franchise in 1885, there has only been one such occasion – Edward Heath’s singular victory in 1970. All others, without exception, have involved coalitions, minority government or parliaments with too narrow a majority to allow government for a full term.
Transfers of power in British government
| Year |
Outgoing government |
Incoming government |
| 1905* |
Conservative |
Working majority |
Liberal |
Minority |
| 1915* |
Liberal |
Minority |
Lib-Con-Lab |
Coalition |
| 1922* |
Nat-Lib-Con |
Coalition |
Conservative |
Working majority |
| 1924* |
Conservative |
Minority |
Labour |
Minority |
| 1924 |
Labour |
Minority |
Conservative |
Working majority |
| 1929 |
Conservative |
Working majority |
Labour |
Minority |
| 1931* |
Labour |
Minority |
Con-Lib-Nat Lab |
Coalition |
| 1940* |
Conservative |
Working majority |
Con-Lab-Lib |
Coalition |
| 1945 |
Coalition/ caretaker |
Coalition |
Labour |
Working majority |
| 1951 |
Labour |
Inadequate majority |
Conservative |
Working majority |
| 1964 |
Conservative |
Working majority |
Labour |
Inadequate majority |
| 1970 |
Labour |
Working majority |
Conservative |
Working majority |
| 1974 |
Conservative |
Working majority |
Labour |
Minority |
| 1979 |
Labour |
Minority |
Conservative |
Working majority |
| 1997 |
Conservative |
Minority |
Labour |
Working majority |
| 2010 |
Labour |
Working majority |
Con-LD |
Coalition |
* Transfer of power took place with out an election. Elections followed shortly afterwards in 1905-1906, 1922 and 1931 which ratified the new governments. The first transfer in 1924 followed a liottle after an election; arguably 1974 and 2010 when incumbent governments stayed on for a few days, are comparable.
Coalition government
The general election of 6 May 2010 was a remarkable enough campaign and result, even without the dramatic political developments of the following week in which the Conservative- Lib Dem coalition was agreed – Britain’s first coalition formed outside wartime or emergency since 1918, or arguably even 1895. By comparison with other nations, even those quite experienced in coalition government,
the inter-party discussions were orderly and took place relatively rapidly, enabling the agreement of a coalition programme and formation of a government the week after the general election. There was no financial crisis (even given the unstable conditions in world markets) and few in either coalition party feel that they have traded away their manifesto commitments in the proverbial (and largely mythical) smoke-filled room – most of the policies of the government reflect those of the larger party in the coalition, namely the Conservatives. Many of the spectres conjured up about hung parliaments and coalitions have turned out to be entirely illusory; Britain’s political leaders proved capable of dealing with the new situation.
The possibility of reform
The 2010 election also involved the serious prospect of a change to the electoral system for the House of Commons. The outgoing Labour government’s manifesto promised a referendum on the Alternative Vote (AV). The two incoming coalition parties had different policies (the Lib Dems for proportional representation, the Conservatives for FPTP) but compromised on a referendum on AV
as well.
The election results
2010 results
| Party |
Votes |
Votes % |
Change on 2005 % |
Seats |
Seast % |
Change on 2005 |
| Conservative |
10,698,394 |
36 |
3.8 |
306 |
47.1 |
97 |
| Labour |
8,609,527 |
29 |
-6.2 |
258 |
39.7 |
-91 |
| Lib Dem |
6,836,824 |
23 |
1 |
57 |
8.8 |
-5 |
| UKIP |
919,546 |
3.1 |
0.9 |
0 |
0 |
0 |
| BNP |
564,331 |
1.9 |
1.2 |
0 |
0 |
0 |
| SNP |
491,386 |
1.7 |
0.1 |
6 |
0.9 |
0 |
| Green |
285,616 |
1 |
-0.1 |
1 |
0.2 |
1 |
| Sinn Fein |
171,942 |
0.6 |
-0.1 |
5 |
0.8 |
0 |
| DUP |
168,216 |
0.6 |
-0.3 |
8 |
1.2 |
-1 |
| Plaid Cymru |
165,394 |
0.6 |
-0.1 |
3 |
0.5 |
1 |
| SDLP |
110,970 |
0.4 |
-0.1 |
3 |
0.5 |
0 |
| UCUNF |
102,361 |
0.3 |
-0.1 |
0 |
0 |
-1 |
| APNI |
42,762 |
0.1 |
0 |
1 |
0.2 |
1 |
In contrast to 2005, the electoral system did not produce a House of Commons majority for a party whose support lay in the mid-30 per cent range; the Conservatives fell short in 2010 while Labour, with a slightly lower share of the UK vote, managed to win a comfortable majority in 2005. However, the share of seats for both the Conservatives and Labour was markedly higher than the parties’ share of the popular vote – 57 per cent of the vote between them produced 89 per cent of the seats. As in election after election, the Liberal Democrats’ share of seats was much lower than their share of the vote, and in 2010 they suffered a perverse result of their national share of the vote going up a bit and their number of seats going down. Among the smaller parties, UKIP was easily the largest, with nearly a million votes, but it did not even come close to gaining representation in the House of Commons. In contrast, smaller parties with concentrated support such as the Democratic Unionist Party, Sinn Fein and Plaid Cymru managed to get similar shares of seats to votes, and the Greens broke through by exploiting the ability of FPTP to reward targeted campaigning and concentrated votes and win in Brighton Pavilion.
Percentage vote in UK elections 1945-2010
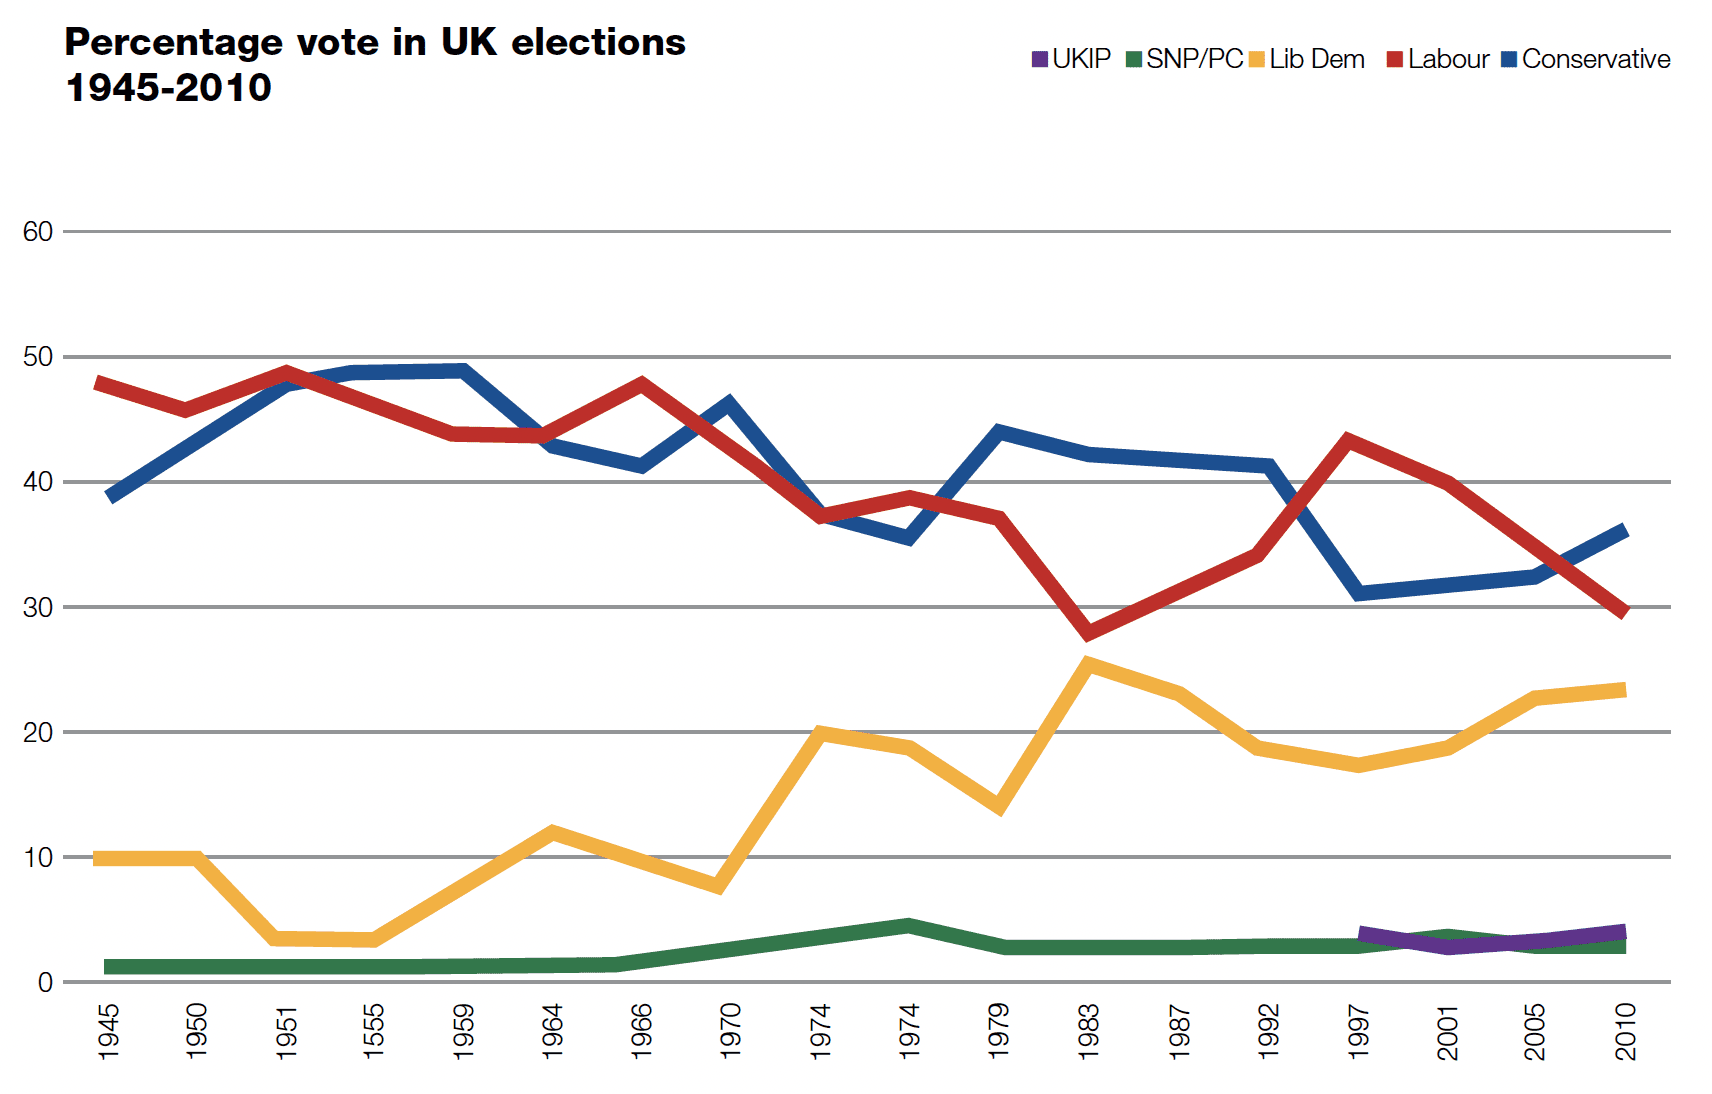
Looking at the longer-term trends, it is clear that in terms of the popular votes cast, the 2010 election resembles 2005 more closely than either election resembles anything previously. There was a strongly rooted two party system from 1945 (actually back to 1931) to 1974, in which Conservative and Labour could command solid blocs of support in the electorate, but since 1974 no party has managed more than the 43.9 per cent support won by the Conservatives in 1979. First Labour, then the Conservatives, and now Labour again, have plunged to historically low levels of support in general elections (and suffered even wilder fluctuations in mid-term elections). Support for the Liberals and Liberal Democrats has tended to rise, although the pattern seems to be for it to come in sharp jumps (1964, 1974, 1983) followed by gradual declines. For a time during the campaign, 2010 looked as if it would see a fourth sharp spike in Lib Dem support, up to 30 per cent or thereabouts, but it was not to be.
Seats won in UK Parliamentary elections, 1974-2010

In terms of seats, the composition of the House of Commons reflected (if rather exaggerated) the two-party voting patterns of Britain from 1945 until 1974, but since then the rise in representation for third and fourth parties has not kept pace with the rise in their support among the electorate. It took until 1997 for the proportion of MPs unaffiliated to the Conservatives or Labour to climb above 10 per cent (for the first time since 1929) and there has been no great breakthrough despite the very low shares won by Conservative and Labour in 2005 and 2010.
Votes per MP, 2010
An easy way of demonstrating uneven results for the parties in the election is to divide each party’s total vote by the number of MPs it obtained.
Three parties with significant levels of support failed to obtain any seats for their votes, namely UKIP, BNP and UCUNF.
Turnout
Turnout in the 2010 general election was 65.1 per cent.
This was a modest increase on the very low- level turnout reached in the two previous elections, when it was only around 60 per cent. It was still well below the electoral participation that used to be regarded as normal – in no previous election since 1918 had turnout fallen below 70 per cent.
Over the long term, there are several well- established factors that influence turnout. One is administrative – how accurate the register may be, and the number of people who are on the register despite having moved away or died. The key political variables are how competitive the voters perceive an election to be, and how important they feel the difference between the parties to be. Turnout in elections like 2001, when the result is perceived as a foregone conclusion and the differences as not very important, is low, while it is high in elections like 1992 when the election is seen as close and the result as being important. The context in 2010 seemed more uncertain than in most elections (since 1979, only 1992 has been comparable), and passions among the parties’ supporters seemed slightly stronger than they had in other recent elections.
However, there does also seem to have been a steady decline in turnout over time, reflecting weakening attachment by electors to political parties and to the political process in general. The drop in 2001 apparently reflected a sudden change of attitude by people who were not particularly interested in politics, and now decided that they did not feel much obligation to vote. It is lowest among young people and among some, but by no means all, ethnic minority communities. That it is so low among young people is worrying, because unless they are socialised into voting at some point, turnout will continue to drop.
Turnout in 2010 appears to have been higher among men than women, although this is an unusual pattern (there is normally little difference). Ever since the late 1980s turnout has tended to be higher among the middle class, homeowners and the more educated, and this was the pattern again in 2010 according to the best available estimates.
Turnout at constituency level is influenced mostly by the demographics of the seat. This is one of the reasons for the pro-Labour bias in the electoral system, in which for a given share of the vote, Labour will win more seats than the Conservatives. Safe Conservative seats tend to have concentrations of high turnout groups like the upper middle class and older people, so the party piles up large numbers of surplus votes that swell MPs’ majorities. Safe Labour seats in city areas, with younger and poorer populations, have lower turnout and therefore the party wastes fewer votes.
Turnout in several categories of seat
Turnout is also influenced by political competitiveness – marginal seats tend to produce higher turnout.
There may be some direct effect, in that some people know that their seat is safe and they do not vote because they know that it would make no difference.
But it is likely that the main mechanism is through the parties. Campaign activity (leafleting, phone canvassing, knocking on doors) is more intense in marginals, and this makes more voters aware of the election and encourages them to feel they have a stake in the process.
It does appear that marginality is worth a couple of extra points on turnout, but a more precise finding has to await statistical analysis so that the effects of marginality and demographics can be separated out. The contrast between the 100 safest Conservative seats, whose turnout is above average and higher than that in marginals, and the 100 safest Labour seats, where turnout is particularly low, suggests that the effect of demographics is much stronger than that of marginality.
By international comparison, Britain’s electoral participation in 2010 was fairly low. The table on Page 11 shows turnout in the latest election in the 27 European Union countries, plus a few others with parliamentary systems.
Most of the EU states with turnout lower than Britain are former communist states in eastern and central Europe, where civic participation is low in general. In general, countries with proportional voting systems have higher turnout than those with single seat majoritarian systems.
Britain’s lack of democratic enthusiasm remains a problem; the fact that fewer than two electors in three cast votes in the most competitive election since 1992 indicates that alienation from the electoral process has certainly not gone away.
Turnout in recent general elections in EU and other states
| Rank (EU) |
Country |
Last election |
Turnout % |
Electoral system |
| 1 |
Malta |
Mar-08 |
93.3 |
STV+ |
| 2 |
Belgium |
Jun-07 |
91.1 |
(CV) Semi open list |
| 3 |
Luxembourg |
Jun-09 |
90.9 |
(CV) Open list |
| 4 |
Cyprus |
May-06 |
89 |
Semi open list |
| 5 |
Denmark |
Nov-07 |
86.6 |
Tiered open list |
| 6 |
Sweden |
Sep-06 |
82 |
Semi open list |
| 7 |
Austria |
Oct-08 |
81.7 |
Semi open list |
| 8 |
Italy |
Apr-08 |
80.4 |
Majoritarian closed list |
|
New Zealand |
Nov-08 |
79.5 |
MMP |
|
South Africa |
Apr-09 |
77.3 |
Closed list |
|
Norway |
Sep-09 |
76.4 |
Semi open list |
| 9 |
Spain |
Mar-08 |
76 |
Closed local list |
| 10 |
Netherlands |
Jun-10 |
75.4 |
Semi open list |
| 11 |
Greece |
Oct-09 |
70.9 |
Majoritarian open list |
| 12 |
Germany |
Sep-09 |
70.8 |
MMP |
|
Japan |
Aug-09 |
69.3 |
MMM |
| 13 |
Ireland |
May-07 |
67 |
STV |
|
Israel |
Feb-09 |
65.2 |
Closed national list |
| 14 |
United Kingdom |
May-10 |
65.1 |
FPTP |
| 15 |
Finland |
Mar-07 |
65 |
Open list |
| 16 |
Hungary |
Apr-10 |
64.4 |
Tiered lists/two-round |
| 17 |
Slovenia |
Sep-08 |
63.1 |
Semi open list |
| 18 |
Czech Republic |
May-10 |
62.6 |
Semi open list |
|
Iraq |
Mar-10 |
62.5 |
Open list |
| 19 |
Estonia |
Mar-07 |
61.9 |
Semi open list |
| 20 |
Latvia |
Oct-06 |
61 |
Semi open list |
| 21 |
Bulgaria |
Jul-09 |
60.9 |
MMP |
|
Jamaica |
Sep-07 |
60.4 |
FPTP |
| 22 |
France |
Jun-07 |
60 |
Two-round |
| 23 |
Portugal |
Oct-09 |
59.7 |
Closed list |
|
India |
Apr/May 09 |
59.7 |
FPTP |
|
Canada |
Oct-08 |
58.8 |
FPTP |
| 24 |
Slovakia |
Jun-06 |
54.7 |
Semi open list |
| 25 |
Poland |
Oct-07 |
53.9 |
Closed local list |
| 26 |
Lithuania |
Oct-08 |
48.6 |
MMM |
| 27 |
Romania |
Nov-08 |
39.2 |
MMP |
(CV: compulsory voting; STV+: STV with national seat adjustment; MMP: Mixed Member Proportional; MMM: Mixed Member Majoritarian
The 2010 election in the nations of the UK
England
| Party |
Votes |
Votes % |
Change on 2005 % |
Seats |
Seats % |
Change on 2005 |
| Conservative |
9,908,169 |
39.6 |
3.9 |
297 |
56.1 |
91 |
| Labour |
7,042,398 |
28.1 |
-7.4 |
191 |
36.1 |
-87 |
| Lib Dem |
6,076,189 |
24.2 |
1.3 |
43 |
8.1 |
-4 |
| UKIP |
866,633 |
3.5 |
0.9 |
0 |
– |
– |
| BNP |
532,333 |
2.1 |
1.3 |
0 |
– |
– |
| Green |
258,954 |
1 |
-0.1 |
1 |
0.2 |
1 |
| Speaker |
22,860 |
0.1 |
0.1 |
1 |
0.2 |
1 |
| Respect |
33,251 |
0.1 |
-0.1 |
0 |
– |
-1 |
| Ind KHHC |
16,150 |
0.1 |
0 |
0 |
– |
-1 |
In one sense, the Conservatives won the election decisively in England, with a vote share more than 11 points ahead of Labour and a clear majority of parliamentary seats. This contrasted with the anomalous result in England in 2005, when the Conservatives had a very narrow lead in vote share but Labour won an overall majority of seats. However, even in 2010 the Conservative vote share was still under 40 per cent, well below what it was in the 1979-97 period and comparable to their losing performances in 1974.
For Labour, there was not a great deal to celebrate in the English results; the party polled its lowest vote share since 1918, with the exception of 1983. At least the party did not come as close as it did in 1983 to coming third in votes in England. It was the second-best Liberal year in England since 1923 (after, again, 1983) in terms of share of the vote, although the haul in seats disappointed the party.
It is worth noting that while Scottish and Welsh politics were revolutionised by the rise of nationalism in the 1970s, there was no comparable change in England where a
three party system remained firmly established through to the last decade. The UKIP vote in 2010 showed that there is a base of support
(small, as yet, in general elections) for the party. It polled a higher share in 2010 than the combined share of UKIP and the Referendum Party in 1997, when the political context was more favourable (Europe high on the public agenda, many Conservatives dissatisfied
with a tired government, and Sir James Goldsmith’s millions spent on the campaign). The low-end results for both Labour and Conservative, and the emergence of significant fourth parties (UKIP in votes, the Greens in winning a seat), suggest that the long-term future is for multi-party politics beyond the big three in England as well.
In terms of seats, both the Conservatives and Labour won much larger shares than they did in votes, with the Conservatives translating 40 per cent of the vote into 56 per cent of the seats. The Liberal Democrats were the principal losers in terms of seats, with a little less than a quarter of the vote producing a twelfth of the seats available.
Seats won by party in England 1974-2010
Votes share in England, 1974 - 2010
Scotland
| Party |
Votes |
Votes % |
Change on 2005 % |
Seats |
Seats % |
Change on 2005 |
| Labour |
1,035,528 |
42 |
3.1 |
41 |
69.5 |
1 |
| SNP |
491,386 |
19.9 |
2.3 |
6 |
10.2 |
– |
| Lib Dem |
465,471 |
18.9 |
-3.7 |
11 |
18.6 |
– |
| Conservative |
412,855 |
16.7 |
0.9 |
1 |
1.7 |
– |
| UKIP |
17,223 |
0.7 |
0.3 |
|
|
|
| Green |
16,827 |
0.7 |
-0.3 |
|
|
|
| (Speaker) |
|
|
|
|
|
-1 |
The 2010 election in Scotland was notable in its complete detachment from the trends in England and Wales. The Scottish Labour Party did not just keep the national swing down, but actually increased its share of the vote. This reflects the traditional commitment of Scotland to centre-left government (and the return of many Labour voters who had withheld their support in 2005), but was also in 2010 a ‘favourite son’ vote for Gordon Brown. The only seats to change hands were a technical transfer of Glasgow North East from Speaker to Labour (which took place at a by-election in 2009) and Labour’s recovery of two by-election losses, Dunfermline & West Fife (2006, Lib Dem) and Glasgow East (2008, SNP).
The Scottish Conservatives were the principal losers from the electoral system, with one vote in six for the party translating into one seat out of 59 (David Mundell’s hold in Dumfriesshire, Clydesdale & Tweeddale). Labour’s represen- tation benefited from a swing in the party’s favour and also being by far the leading political party in Scotland, over 20 points ahead of its nearest rival among Scottish voters, the SNP, and consolidated its position of dominance in Scotland’s representation at Westminster which it has enjoyed since at least 1987.
The strong results for Labour incumbents in several marginal seats means that Labour’s position is perhaps even more formidable than it looks, because few of the party’s MPs are vulnerable to anything except a very large swing. The Conservatives’ target seats of East Renfrewshire and Stirling receded even further, the SNP are further behind in Ochil & South Perthshire, and Labour’s line held in seats threatened by the Lib Dems in Aberdeen and Edinburgh. Itwould only take relatively small further swings to Labour for several more seats to fall to
the party, including East Dunbartonshire, Edinburgh West and Argyll & Bute (all from the Liberal Democrats), Dumfriesshire (from the Conservatives) and Dundee East (from the SNP). Under the FPTP electoral system
there seems little prospect of Labour’s grip on Scottish representation at Westminster being broken even if its vote falls considerably from its relatively high level in 2010.
Even had the Conservatives won a slightly larger swing and formed a majority government, they fell so short in Scotland that they would still have only had one MP north of the border, who would have ended up Scottish Secretary. Such a position would have been awkward to say the least. However, thanks to the Liberal Democrats gaining more or less their proportional share of seats, the governing UK coalition does have some depth of representation in Scotland.
Seats won and share of vote by party 1974-2010
Wales
| Party |
Votes |
Votes % |
Change on 2005 % |
Seats |
Seats % |
Change on 2005 |
| Labour |
531,601 |
36.2 |
-6.5 |
26 |
65 |
-4 |
| Conservative |
382,730 |
26.1 |
4.7 |
8 |
20 |
5 |
| Lib Dem |
295,164 |
20.1 |
1.7 |
3 |
7.5 |
-1 |
| Plaid Cymru |
165,394 |
11.3 |
-1.3 |
3 |
7.5 |
1 |
| UKIP |
35,690 |
2.4 |
1 |
|
|
|
| BNP |
23,088 |
1.6 |
1.5 |
|
|
|
| Green |
6,293 |
0.4 |
-0.1 |
|
|
|
| (Independent) |
|
|
|
|
|
-1 |
Wales, in sharp contrast to Scotland, was a fairly successful area for the Conservatives, with the swing (5.6 per cent) being the same as in England on this occasion. The Tories gained four seats from Labour (Aberconwy; Cardiff North, where Conservative electoral reformer Jonathan Evans narrowly defeated Julie Morgan; Carmarthen West & South Pembrokeshire; and Vale of Glamorgan) and in the biggest reverse of the election in Wales, former Conservative AM Glyn Davies defeated celebrity Lib Dem, Lembit Opik, in Montgomeryshire. Plaid Cymru also made a notional ‘gain’ from Labour in the radically revised seat of Arfon, and Labour recovered Blaenau Gwent from Independent Dai Davies.
Labour were heavily over-represented in Wales compared to their share of the vote, having
a clear majority (nearly two thirds) on 36 per cent of the vote. The Liberal Democrats were particularly disadvantaged by the electoral system, recording some poor results in seats they held or aspired to gain (with the notable exception of Ceredigion) and having surges in their share of the vote in constituencies such as Pontypridd and Merthyr Tydfil & Rhymney unrewarded by seat gains.
Over the longer term, Labour’s vote in Wales reached a historic low in 2010 – lower even than in 1983 – although the Conservatives failed by some way to recapture the sort of vote share that they enjoyed in Wales when they were winning majorities at Westminster in 1979-97.
Share of vote % by party in Wales 1974-2010
Seats won by party in Wales 1974-2010
Northern Ireland
| Party |
Votes |
Votes % |
Change on 2005 % |
Seats |
Seats % |
Change on 2005 |
| Sinn Fein |
171,942 |
25.5 |
1.2 |
5 |
27.8 |
|
| DUP |
168,216 |
25 |
-8.7 |
8 |
44.4 |
-1 |
| SDLP |
110,970 |
16.5 |
-1 |
3 |
16.7 |
|
| UCUNF |
102,361 |
15.2 |
-2.6 |
0 |
0 |
-1 |
| Alliance |
42,762 |
6.4 |
2.5 |
1 |
5.6 |
1 |
| Ind U |
42,481 |
6.3 |
|
1 |
5.6 |
1 |
| TUV |
26,300 |
3.6 |
|
0 |
0 |
|
| Green |
3,542 |
0.5 |
|
0 |
0 |
|
Northern Ireland elections are sometimes mirror images of the contest in Great Britain in terms of the level of public interest and
turnover of seats. In 2001, while turnout slumped and there were few changes in Britain, it was a dramatic election in Northern Ireland. In 2010, however, there was a quieter election than the last couple in the province and turnout fell sharply.
The result, though, was notable in some ways. It was the first Westminster election in Northern Ireland in which Sinn Fein was the largest single party (the party also placed first in the European election in 2009). The two main nationalist parties outpolled the combined showing of the two main unionist parties for the first time (42.0 per cent to 40.2 per cent, although Unionist independents and Traditional Unionist Voice polled another 9.9 per cent, taking the combined unionist vote to just over 50 per cent).
Two seats changed hands in Northern Ireland. In one of the most surprising results of the whole night, the Alliance Party candidate, Naomi Long, won Belfast East on a huge swing, unseating the DUP First Minister Peter Robinson. It was the first seat the Alliance had won in a Westminster election, although it had the adherence of an ex-Conservative in the 1970-74 Parliament and polled well on a couple of previous occasions in Belfast East. The other change was a more technical one. Lady Sylvia Hermon had been the Ulster Unionist Party’s sole representative in the previous Parliament, but fought in 2010 as an Independent rather than under the UUP’s joint banner with the Conservatives. She held her North Down seat with a huge majority.
Rather by accident, the proportions of MPs elected from each community were very much in proportion with the votes cast. The Unionist parties, plus the Unionist Independents in Fermanagh & South Tyrone and North Down, won 50.4 per cent of the vote and half the seats; Nationalists won 42.0 per cent of the vote and 44.4 per cent of the seats, and there was one Alliance seat (5.6 per cent of the total) for the 7.6 per cent of those voting for other candidates.
Within the Nationalist community there was also an uncannily proportional result, with the SDLP winning 39 per cent of Nationalist votes and 3 out of 8 seats (37.5 per cent) and Sinn Fein the remainder.
The Unionist MPs, however, are unrepresentative of the votes cast. They consist of 8 DUP MPs and one Independent, while the Ulster Unionist Party/ Conservative alliance had 30 per cent of the Unionist vote but no MPs to show for it.
Vote share % by party in Northern Ireland 1974-2010
Seats won in Northern Ireland by party 1974-2010
A national election?
Swing
Although there were wide variations in swing at the level of individual constituencies, the broad pattern of electoral change in the different parts of Britain was surprisingly uniform, with a few very marked exceptions. There was a national swing of 5 per cent from Labour to Conservative (pretty comparable with past Conservative returns to power in 1970 and 1979), but this consisted of a swing in most of the country of a bit over 6 per cent, from which several areas opted out. Scotland went its own way by swinging in Labour’s favour, Merseyside had no significant swing (which dragged the North West to its below-average 4.3 per cent swing), and London moved by much less than average. The differences between swing in other regions were smaller, although there was a general tendency for the Eastern regions – apparently regardless of class composition and political traditions – to swing a bit more enthusiastically to the Tories.
Taking a longer-term perspective, looking back to the election of 1992 when the gap in vote share between Conservative and Labour was similar to what it was in 2010, gives a clearer picture of the cumulative effect of regional swings. Wales emerges from this analysis as Labour’s worst region (the party’s vote share has fallen by 13.3 percentage points; the
Conservatives’ drop was rather low, 2.5 per cent). Scotland is at the other end of the scale, with Labour actually increasing its support since 1992 and the Conservatives dropping sharply. The other region that has seen a significant shift since 1992 is London, where the Conservative share has dropped most (down 10.8 per cent) and Labour’s support held steady (down only 0.4 per cent). The other regions of England vary less, although there is a distinct east-west pattern to swing, with the eastern side of England (plus the Midlands) trending Conservative and the west (except the West Midlands) to Labour. Perhaps surprisingly, the South East has seen a relative Labour improvement since 1992.
This analysis has concerned the votes cast by the electors, and underpins the general theme of the gradual regional polarisation of politics over the long term – which in turn may be linked to the workings of the electoral system in reflecting the regional differences in an exaggerated form in parliament.
One of the most surprising features about the relationship between votes and seats in 2010 is that nearly one Labour vote in five (19.6 per cent) was cast in the three southern English regions (Eastern, South East, South West) – more than in Scotland and Wales combined. But the composition of Labour’s Parliamentary party is very different – fewer than one Labour MP in twenty represents a seat in southern England outside London. In these regions there are ten Labour MPs (Plymouth Moor View, Exeter, Bristol South, Bristol East, Oxford East, Slough, Southampton Itchen, Southampton Test, Luton North and Luton South) while – with fewer actual Labour voters – Scotland and Wales send 67 Labour representatives. While in elections Labour wins and it does gain representation in the south, these are marginal and vulnerable to setbacks. That Labour’s parliamentary party is so lopsidedly northern, Welsh and Scottish will affect its political approach and policy making, and internal processes like leadership elections.
Swing (%) from Labour to Conservative by region
Distribution of Labour votes and seats (%) by region, 2010
Distribution of Conservative votes and seats (%) by region, 2010(%) by region, 2010
A polarising parliament: votes and seats by region 1992 and 2010
|
Conservative votes % 1992 |
Conservative votes % 2010 |
Conservative seats % 1992 |
Conservative seats % 2010 |
Labour votes % 1992 |
Labour votes % 2010 |
Labour seats % 1992 |
Labour seats % 2010 |
| Southern |
39.5 |
43.7 |
47.9 |
53.1 |
19.5 |
19.6 |
3.7 |
3.9 |
| London |
11.6 |
11 |
14.3 |
9.2 |
11.5 |
14.1 |
12.9 |
14.7 |
| Midlands |
18.1 |
18.3 |
17 |
21 |
18.4 |
17.1 |
15.9 |
15.1 |
| Wales |
3.6 |
3.6 |
1.8 |
2.6 |
7.5 |
6.2 |
10 |
10.1 |
| Northern |
22 |
19.6 |
15.8 |
13.8 |
33.2 |
30.6 |
39.5 |
40.3 |
| Scotland |
5.4 |
3.9 |
3.3 |
0.3 |
9.9 |
12 |
18.1 |
15.9 |
The Conservative Party in parliament is unrepresentative of its voters, in a mirror image of Labour’s distorted representation. Although southern England is its strongest region in votes, this dominance is exaggerated in seats to the extent that a majority of Tory MPs represent seats in southern England.
Northerners and Scots who vote Conservative got relatively little representation compared
to their southern colleagues. The concerns of southern England will be more immediately felt by the party in government than those of the north and Scotland, a potential problem given that the impact of austerity will be uneven across the regions. Conflict between the Conservative and Labour parties will be refracted through this regionally polarised representation.
Comparison with 1992 indicates that the southern regional skew of Conservative votes and MPs has increased, while Labour’s
vote distribution has skewed a bit towards Londoners and Scots, although there is an uncanny similarity between the share of the Labour parliamentary party for each region in 1992 and 2010. It is very much back to the much-discussed ‘Southern Discomfort’ for Labour, while the Conservatives seem to be developing a northern problem (particularly in the big cities) alongside their all too obvious troubles in Scotland.
Local representation
Local representation
One of the features of the combination of FPTP elections and Britain’s social and political geography is that some areas end up being dominated by a single party despite that party having the support of half, or fewer, of those voting. Conversely, it is possible for parties
to win significant shares of the vote without winning parliamentary seats – the prize (if not an MP) in 2010 went to the Surrey Lib Dems whose 28.5 per cent of the vote (much more the party’s national share) went unrepresented. This produces the phenomena of the ‘electoral desert’ and what one might call the ‘one party state’ (although the overtone of dictatorship to this term does not apply).
Some of these deserts and strongholds are persistent and apply to elections with widely different national outcomes (such as the Conservatives in Surrey with the sole exception of 2001, or Labour in Glasgow) and some are more transient or variable. In some counties such as Hertfordshire and Kent, Labour can win considerable numbers of seats in a good year for the party, but these are all marginals, which are lost when the tide turns (as they were in 2010). In others, such as West yorkshire, a good Labour year will wipe out all the Conservatives. A party’s seats in a generally hostile region will often tend to be marginal and vulnerable to swings and to boundary changes.
Electoral ‘deserts’ in England, 2010
| County |
Party |
Vote % |
Votes |
PR seats |
| Surrey |
Liberal Democrat |
28.5 |
166,667 |
3 |
| Greater Manchester SE |
Conservative |
28 |
120,544 |
3 |
| Oxfordshire |
Liberal Democrat |
28 |
92,999 |
2 |
| North yorkshire |
Liberal Democrat |
27.9 |
111,283 |
2 |
| Warwickshire |
Labour |
27.6 |
79,428 |
2 |
| West Sussex |
Liberal Democrat |
27.4 |
114,014 |
2 |
| Northamptonshire |
Labour |
25.7 |
88,535 |
2 |
| Hereford & Worcester |
Liberal Democrat |
25.3 |
100,433 |
2 |
| Berkshire |
Liberal Democrat |
25.2 |
104,133 |
2 |
| Suffolk |
Liberal Democrat |
24.1 |
87,695 |
2 |
| Durham |
Liberal Democrat |
24.1 |
69,838 |
2 |
| Hertfordshire |
Liberal Democrat |
24 |
134,793 |
3 |
| Shropshire |
Liberal Democrat |
23.5 |
56,622 |
1 |
| Leicestershire |
Liberal Democrat |
23.3 |
118,341 |
2 |
| Humberside |
Liberal Democrat |
22.5 |
92,399 |
2 |
| Tyne & Wear |
Liberal Democrat |
21.7 |
106,380 |
3 |
| Derbyshire |
Liberal Democrat |
21.6 |
110,385 |
2 |
| Tyne & Wear |
Conservative |
21.4 |
105,117 |
3 |
| Durham |
Conservative |
21.4 |
62,077 |
1 |
| Suffolk |
Labour |
21.3 |
77,775 |
1 |
| Cheshire |
Liberal Democrat |
21.2 |
109,601 |
2 |
| Kent |
Labour |
21.1 |
174,599 |
4 |
| Gloucestershire |
Labour |
21 |
66,858 |
1 |
| Kent |
Liberal Democrat |
20.9 |
173,176 |
4 |
| Buckinghamshire |
Liberal Democrat |
20.9 |
75,881 |
2 |
| South yorkshire |
Conservative |
20.6 |
121,131 |
3 |
| Warwickshire |
Liberal Democrat |
20.5 |
58,837 |
1 |
| Bedfordshire |
Liberal Democrat |
20.3 |
59,184 |
1 |
| Lincolnshire |
Liberal Democrat |
20.2 |
70,827 |
2 |
| East Sussex |
Labour |
20.1 |
81,571 |
2 |
| South East London |
Liberal Democrat |
19.9 |
95,949 |
2 |
| Lincolnshire |
Labour |
19.4 |
68,043 |
1 |
| Nottinghamshire |
Liberal Democrat |
19.2 |
65,676 |
2 |
| Northamptonshire |
Liberal Democrat |
19.1 |
65,676 |
1 |
| Norfolk |
Labour |
19 |
83,088 |
2 |
| Hertfordshire |
Labour |
19 |
106,478 |
2 |
| Essex |
Labour |
18.6 |
157,134 |
4 |
| Staffordshire |
Liberal Democrat |
18.1 |
97,823 |
2 |
| West London |
Liberal Democrat |
17 |
80,468 |
2 |
| Hereford & Worcester |
Labour |
16.7 |
66,394 |
1 |
| Cambridgeshire |
Labour |
16.2 |
60,983 |
1 |
| Buckinghamshire |
Labour |
15.5 |
56,389 |
1 |
| Wiltshire |
Labour |
15.3 |
52,364 |
1 |
| East London |
Liberal Democrat |
15 |
76,520 |
2 |
| Black Country |
Liberal Democrat |
14.5 |
73,446 |
2 |
| West Sussex |
Labour |
13.1 |
54,453 |
1 |
| Dorset |
Labour |
12.2 |
47,594 |
1 |
| Surrey |
Labour |
9.8 |
57,032 |
1 |
| Cornwall |
Labour |
8.6 |
24,257 |
0 |
| Somerset |
Labour |
7.7 |
22,163 |
0 |
| TOTAL (major party) |
|
17 |
4,252,007 |
|
| Minor parties |
|
8 |
2,009,536 |
|
| Overall total |
|
25 |
6,140,999 |
|
English regions and counties
A striking fact about the 2010 election in England was that nearly one voter in four (25.0 per cent) not only did not succeed in electing an MP of their choice in their constituency, but also did not see an MP of their party elected in their broader locality either. There is a sense that an MP can put their party’s case and represent its voters’ point of view in that general area; for instance, having an MP for Withington enables Liberal Democrats in the rest of Manchester to feel somewhat represented in Parliament (and likewise for Labour in Oxfordshire thanks to their hold on Oxford East). However, voters for all three main English parties in many areas do not have that consolation – and neither does any voter for other candidates, except for Greens in East Sussex and John Bercow’s supporters in Buckingham.
Conservative votes and seats in Metropolitan England, 2010
|
Votes % |
Seats |
Seats % |
| Greater Manchester |
27.3 |
2 |
7.4 |
| Merseyside |
21.1 |
1 |
6.7 |
| South yorkshire |
20.6 |
0 |
0 |
| Tyne & Wear |
21.4 |
0 |
0 |
| West Midlands |
33.5 |
7 |
25.0 |
| West yorkshire |
32.9 |
7 |
31.8 |
There were eight English counties (plus a subsection of Greater Manchester) where a party with more than a quarter of the vote ended up unrepresented in that area. The Liberal Democrats were particularly prone to this effect because their vote was evenly distributed, especially in southern England.
Labour’s largest unrepresented shares of the vote were in areas where the party had held marginals in 2005 but lost them in 2010. In East Sussex, a particularly striking example, Labour went from holding half the seats in the county in 2005 on 25.4 per cent, to nothing in 2010 despite winning 20.1 per cent. Both results demonstrate the lack of relationship between vote share and seats won under FPTP.
The Conservatives gained seats in several areas where they had been unrepresented in 2005 (Cornwall, Cleveland, Merseyside) but were still unrepresented in South yorkshire, Durham and Tyne & Wear, despite respectable shares of the vote. They also picked up a few seats in areas where they had previously been extremely under-represented, such as West yorkshire
and the Black Country, but remained short of representation in the metropolitan counties and great cities of England. Many of the seats they do hold in these areas are marginal and could disappear through boundary changes or be lost on an adverse swing.
Conversely, there are several areas that are completely dominated by one party in terms of parliamentary representation, even though there are substantial votes for other parties. In the circumstances of 2010, several of these were traditionally Conservative counties where Labour toeholds had been knocked off, but the results indicate the volatility of some areas such as Northamptonshire – the Conservatives won all six seats in 1992, a solitary seat in 1997 and 2001, three in 2005, and again everything from the county’s allocation of seven in 2010. The Conservatives’ vote of course did not change nearly as much as the county’s parliamentary representation in this time.
One party counties in England, 2010
| County |
Party |
Vote % |
Seats |
| Surrey |
Conservative |
55.2 |
11 |
| West Sussex |
Conservative |
51.8 |
8 |
| Kent |
Conservative |
50.5 |
17 |
| Hertfordshire |
Conservative |
50.4 |
11 |
| Lincolnshire |
Conservative |
49.8 |
7 |
| Tyne & Wear |
Labour |
48.7 |
12 |
| Northamptonshire |
Conservative |
47.4 |
7 |
| Suffolk |
Conservative |
46.2 |
7 |
| Hereford & Worcester |
Conservative |
45.9 |
8 |
| Warwickshire |
Conservative |
45.7 |
6 |
| Durham |
Labour |
45.3 |
7 |
The regions of Scotland
| Region |
Party |
Vote % |
Votes |
PR seats |
| Central |
SNP |
22.2 |
88,881 |
2 |
| North East |
Conservative |
21.4 |
70,286 |
2 |
| Highlands & Islands |
Labour |
20.3 |
46,933 |
1 |
| Glasgow |
SNP |
17.3 |
39,702 |
1 |
| Mid & Fife |
Conservative |
17.3 |
55,485 |
1 |
| Lothians |
SNP |
17.0 |
61,305 |
1 |
| Highlands & Islands |
Conservative |
16.7 |
38,505 |
1 |
| Lothians |
Conservative |
16.2 |
58,647 |
1 |
| South |
SNP |
15.8 |
52,349 |
1 |
| West |
Conservative |
15.7 |
41,102 |
1 |
| West |
SNP |
15.3 |
40,214 |
1 |
While the Conservatives were most under- represented across Scotland, the SNP probably suffered worst from regional disparities. All six of its MPs were elected from northern Scotland, with all but Dundee East being either rural or having a large rural component. However, the three northern regions from which MPs were elected account for fewer than half of the SNP’s actual voters; the party piled up nearly as many votes in the Central region as in North East but won no MPs from the industrial heartland of urban Scotland. SNP
representation in the Scottish Parliament has always had a much larger urban component because of the proportional electoral system used to elect MSPs.
Labour’s strength in the urban centres was exaggerated by the electoral system, but despite its landslide win across Scotland the party did not win any seats in the Highlands & Islands region, even though it won over 20 per cent. In contrast to England, the Liberal Democrats did relatively well in winning at least a seat across most regions of Scotland, with rural, urban and suburban areas returning Lib Dem MPs.
Although Labour dominated across Scotland, most regions did have at least one non-Labour MP.
One party regions in Scotland, 2010
| Region |
Party |
Vote % |
Seats |
| Central |
Labour |
55.5 |
9 |
| Glasgow |
Labour |
56.2 |
7 |
The regions of Wales
As in England, the Liberal Democrats polled well in several regions of Wales without winning seats, although in general the pattern of representation was a bit more pluralistic (with the exception of the all-Labour region of South Wales West). Plaid Cymru’s vote in the South Wales regions was small but this may reflect tactical voting rather than the true level of the party’s support – it certainly polls much better in these regions in Welsh Assembly elections.
Electoral ‘deserts’ in Wales, 2010
| Region |
Party |
Vote % |
Votes |
PR seats |
| South Wales West |
Conservative |
20.7 |
51,887 |
1 |
| South Wales West |
Liberal Democrat |
20.0 |
50,246 |
1 |
| South Wales East |
Liberal Democrat |
18.7 |
55,492 |
2 |
| North Wales |
Liberal Democrat |
16.1 |
49,840 |
1 |
| South Wales Central |
Plaid Cymru |
7.8 |
24,587 |
0 |
| South Wales East |
Plaid Cymru |
6.4 |
19,056 |
0 |
| South Wales West |
Plaid Cymru |
8.6 |
21,568 |
0 |
One party region in Wales, 2010
| Region |
Party |
Vote % |
Seats |
| South Wales West |
Labour |
44.2 |
7 |
Constituency results
Constituencies
At a constituency level, the 2010 election produced a post-war record number and proportion of MPs elected by a minority of their own voters – 433 out of 650 (66.6 per cent). This was slightly up on the previous record number of minority winners, 426 in the 2005 election. One MP, Labour’s Dennis
Skinner in Bolsover, had precisely 50 per cent of the votes cast; the other 216 had over half the votes cast.
The chart below shows the transformation from the period from 1950 to 2001, in which most MPs had over 50 per cent in most elections, to the current position where the support of a majority of those voting is unusual. The failure of the 2010 election to produce more majority winners shows that the fragmented electoral pattern of 2005 was not an aberration (to some extent the results in 1974 were a deviation from the normal pattern). This has added strength to the argument for the Alternative Vote, which would enable all MPs to have a majority (albeit on a qualified basis because not all would have a majority of the valid first preferences in the constituency).
As well as a large number of minority winners, there were also increasing numbers of MPs elected with relatively small amounts of support from their constituents. While it is arguable that in multi-party politics a candidate with 48 per cent may represent near enough to a majority (or at least that a majority cannot be assembled for a rival candidate) this is much more dubious when the winner’s support is below 40 per cent. There are 111 MPs in the 2010 parliament with less than 40 per cent support from their own voters. This was a sharp increase on 2005, when 55 MPs had this status, and from 2001 when it was a rare event – 26 slipped through then on such a low share (the number was 20 in 1992 and 9 in 1970).
Of the 111 MPs with less than 40 per cent support in 2010, 56 are Labour (up 29 on 2005), 34 Conservative (up 26, all but one of whom are gains since 2005), 10 Lib Dems (up 3) and 11 Others (up 11: 4 SNP, 3 DUP, 2 Plaid, 1 Green, 1 APNI). This pattern was particularly prevalent in Wales, with nearly one seat in three being decided on less than 40 per cent of the vote.
Majority and minority winners, 1950-2010
Winners on less than 40 per cent (by nation) 2010
| Nation |
Number |
% |
| England |
80 |
15 |
| Wales |
13 |
32.5 |
| Scotland |
14 |
23.7 |
| Northern Ireland |
4 |
22.2 |
| UK |
111 |
17.1 |
The general upward trend in the number of MPs with sub-40 per cent vote shares is apparent in the table above, as is the sharp upward movement in 2010. Three factors seem to govern the prevalence of such small minority winners. One is that it is arithmetically impossible to win with less than 50 per cent in a two-way contest, and the last such contests were in 1979 (and they became rare in 1974).
Winning share of the vote in constituency contests, 1950-2010
| General Election |
Below 40% |
40-50% |
Above 50% (2 candidates) |
Above 50% (3+ candidates) |
| 1950 |
8 |
179 |
115* |
323 |
| 1951 |
0 |
39 |
499* |
87 |
| 1955 |
1 |
36 |
489 |
104 |
| 1959 |
0 |
80 |
373 |
177 |
| 1964 |
7 |
225 |
194 |
204 |
| 1966 |
5 |
180 |
234 |
211 |
| 1970 |
9 |
115 |
185 |
321 |
| 1974 Feb |
40 |
368 |
38 |
189 |
| 1974 Oct |
31 |
349 |
0 |
255 |
| 1979 |
13 |
193 |
3 |
426 |
| 1983 |
70 |
266 |
0 |
314 |
| 1987 |
25 |
258 |
0 |
367 |
| 1992 |
20 |
240 |
0 |
391 |
| 1997 |
49 |
264 |
0 |
336 |
| 2001 |
26 |
307 |
0 |
326 |
| 2005 |
55 |
371 |
0 |
220 |
| 2010 |
111 |
322 |
0 |
217 |
Further, the other candidates need to get at least 20 per cent of the vote (meaning that two party politics needs to have weakened).
Another is that boundary changes, by creating new seats where the tactical position is unclear, make for more 30-something (or 20-something) winners, which usually resolves itself in the next election through tactical voting and incumbency (as in 1983-87 and 1997-2001); another is
a strong national movement of votes that encourages people to support their party even when it does not help much in the constituency.
The persistence of Liberalism in rural Wales and Scotland through the party’s UK
nadir, and the rise of Scottish and Welsh nationalism, meant that 30-something winners were formerly to be found mostly outside England (with some constituencies such
as Meirionnydd, Ceredigion, Caithness and
Aberdeen South being repeatedly won with less than 40 per cent). The 2010 election saw winners with less than 40 per cent on an unprecedented scale in England.
Seats won on low shares of the vote in 2010
Simon Wright, the Lib Dem winner in Norwich South, has the wooden spoon for the lowest share of the vote of any MP in Westminster, at 29.4 per cent. This was lower than any MP recorded in 2005, although still more than the recent record holder Sir Russell Johnston, who held Inverness for the Lib Dems in 1992 with 26.0 per cent.
As one might expect, the 21 seats where the winner had 35 per cent or under were mostly three way marginals. There were 9 seats decided on less than 35 per cent of the vote in 2005, so the 2010 election saw a significant increase in the number of MPs with only a small share of constituency support.
Norwich South election result 2010
| Candidate |
Party |
Vote |
Vote % |
| Wright, Simon |
Liberal Democrat |
13,960 |
29.4 |
| Clarke, Charles |
Labour |
13,650 |
28.7 |
| Little, Antony |
Conservative |
10,902 |
22.9 |
| Ramsay, Adrian |
Green |
7,095 |
14.9 |
| Emmens, Steve |
UKIP |
1,145 |
2.4 |
| Heather, Leonard |
BNP |
697 |
1.5 |
| Polley, Gabriel |
Workers Rev Party |
102 |
0.2 |
MPs with 35 per cent or less of the constituency vote, 2010
| MP |
Constituency |
Party |
Vote % |
| Simon Wright |
Norwich South |
Liberal Democrat |
29.4 |
| Caroline Lucas |
Brighton Pavilion |
Green |
31.3 |
| Alan Reid |
Argyll & Bute |
Liberal Democrat |
31.6 |
| Phil Woolas |
Oldham East & Saddleworth |
Labour |
31.9 |
| Austin Mitchell |
Great Grimsby |
Labour |
32.7 |
| Glenda Jackson |
Hampstead & Kilburn |
Labour |
32.8 |
| Roger Godsiff |
Birmingham Hall Green |
Labour |
32.9 |
| Chris Williamson |
Derby North |
Labour |
33.0 |
| Albert Owen |
ynys Mon |
Labour |
33.4 |
| David Ward |
Bradford East |
Liberal Democrat |
33.7 |
| Gloria de Piero |
Ashfield |
Labour |
33.7 |
| David Simpson |
Upper Bann |
DUP |
33.8 |
| William McCrea |
Antrim South |
DUP |
33.9 |
| Michael Ellis |
Northampton North |
Conservative |
34.1 |
| Oliver Colvile |
Plymouth Sutton & Devonport |
Conservative |
34.3 |
| Gregory Campbell |
Londonderry East |
DUP |
34.6 |
| Ian Murray |
Edinburgh South |
Labour |
34.7 |
| Geraint Davies |
Swansea West |
Labour |
34.7 |
| Gavin Shuker |
Luton South |
Labour |
34.9 |
| Richard Harrington |
Watford |
Conservative |
34.9 |
| Simon Reevell |
Dewsbury |
Conservative |
35.0 |
Majority winners (by party) 2010
| Party |
Number |
% (of party) |
% (of majority winners) |
| Conservative |
126 |
41.2 |
58.1 |
| Labour |
76 |
29.5 |
35.0 |
| Lib Dem |
12 |
21.1 |
5.5 |
| Others |
3* |
– |
– |
Majority winners (by nation) 2010
| Nation |
Number |
% |
| England |
185 |
34.7 |
| Wales |
7 |
17.5 |
| Scotland |
22 |
37.3 |
| Northern Ireland |
3 |
16.7 |
Majority winners
Among the total of majority winners, the Conservatives are rather over-represented. The increase in their vote share pushed a number of seats they had won last time with shares of the vote in the high 40 per cent range over into majority winner status. Conversely, Labour’s falling support – particularly in some hitherto safe seats in Wales and south yorkshire – caused a drop in the number of Labour majority winners.
Labour’s strong result in Scotland increased the proportion of majority winners there a little, while the party’s weak showing in the south Wales valleys knocked the number of Welsh majority winners back significantly. Of all the MPs who gained their seat from another party in 2010 relative to 2005, only one – Labour’s Nick Smith who recaptured Blaenau Gwent from Independent – polled over 50 per cent of the vote (a handful of others reversed defections or by-elections, or won a seat where boundary changes had already changed its partisan allegiance).
The preponderance of the very safest seats is for Labour, with Merseyside and urban Scotland providing many of the most rock- solid constituencies.
Share of the electorate
In terms of the share of the entire electorate voting for the successful candidate, no MP can claim a majority after the 2010 election (there were no majorities of electors in 2005 or 2001 either). The general increase in turnout in 2010 and the increase in the Conservative share of the vote meant that rather more MPs had over 40 per cent than in 2005 – 35 seats as opposed to 3 in 2005. Many of these were in rural seats, which are safely Conservative, although there is a slight tendency for a high winning share of the electorate to be associated with a serious Lib Dem challenge a few years ago but which is now fading – as in Orpington, Maidenhead and Surrey South West. Of the 35 MPs who can claim the support of 40 per cent or more of the electorate, three are Lib Dems (Westmorland & Lonsdale, Norfolk North, Bath), one Labour (Gordon Brown in Kirkcaldy & Cowdenbeath) and the other 31 are Conservatives (including David Cameron in Witney).
The 2010 election saw a lot of very individual constituency-level results and the greater deviation from average results is apparent in the fact that as well as more MPs receiving particularly strong support, there was a rise in the number of MPs with particularly weak local support. Eight MPs, compared to three in 2005, received less than 20 per cent support from their electorates.
The fall in turnout in Northern Ireland, and the erosion of the DUP’s dominance since 2005, caused several Northern Ireland seats to appear in this category, and Labour’s good results in Scotland raised the overall level of support for its MPs (two of the three winners with less than 20 per cent of the electorate in 2005 were in Scottish Labour seats). It is perhaps ironic that two of Labour’s most convinced and tenacious electoral reformers, Austin Mitchell and Alan Johnson, should find themselves in this category.
MPs with over 60 per cent of the vote, 2010
| MP |
Constituency |
Party |
Vote % |
| Steve Rotheram |
Liverpool Walton |
Labour |
72.0 |
| Gerry Adams |
Belfast West |
Sinn Fein |
71.1 |
| George Howarth |
Knowsley |
Labour |
70.9 |
| Stephen Timms |
East Ham |
Labour |
70.4 |
| Willie Bain |
Glasgow North East |
Labour |
68.3 |
| Tom Clarke |
Coatbridge, Chryston & Bellshill |
Labour |
66.6 |
| Joe Benton |
Bootle |
Labour |
66.4 |
| Gordon Brown |
Kirkcaldy & Cowdenbeath |
Labour |
64.5 |
| Stephen Twigg |
Liverpool West Derby |
Labour |
64.1 |
| Sylvia Hermon |
North Down |
Independent |
63.3 |
| William Hague |
Richmond (yorks) |
Conservative |
62.8 |
| Lyn Brown |
West Ham |
Labour |
62.7 |
| Frank Field |
Birkenhead |
Labour |
62.5 |
| Ian Davidson |
Glasgow South West |
Labour |
62.5 |
| Lindsay Roy |
Glenrothes |
Labour |
62.3 |
| Alistair Carmichael |
Orkney & Shetland |
Liberal Democrat |
62.0 |
| Margaret Curran |
Glasgow East |
Labour |
61.6 |
| Gemma Doyle |
Dunbartonshire West |
Labour |
61.3 |
| Dominic Grieve |
Beaconsfield |
Conservative |
61.1 |
| Frank Roy |
Motherwell & Wishaw |
Labour |
61.1 |
| Tom Watson |
West Bromwich East |
Labour |
61.0 |
| Tom Greatrex |
Rutherglen & Hamilton West |
Labour |
60.8 |
| Adam Afriyie |
Windsor |
Conservative |
60.8 |
| James Arbuthnot |
Hampshire North East |
Conservative |
60.6 |
| Greg Hands |
Chelsea & Fulham |
Conservative |
60.5 |
| Cheryl Gillan |
Chesham & Amersham |
Conservative |
60.4 |
| Tim Farron |
Westmorland & Lonsdale |
Liberal Democrat |
60.0 |
MPs with support of more than 43 per cent of the electorate, 2010
| MP |
Constituency |
Party |
Electorate % |
| Tim Farron |
Westmorland & Lonsdale |
Liberal Democrat |
45.5 |
| Cheryl Gillan |
Chesham & Amersham |
Conservative |
45.0 |
| James Arbuthnot |
Hampshire North East |
Conservative |
44.4 |
| Theresa May |
Maidenhead |
Conservative |
43.8 |
| Jeremy Wright |
Kenilworth & Southam |
Conservative |
43.5 |
| Adam Afriyie |
Windsor |
Conservative |
43.4 |
| Paul Beresford |
Mole Valley |
Conservative |
43.1 |
| Jo Johnson |
Orpington |
Conservative |
43.1 |
| Jeremy Hunt |
Surrey South West |
Conservative |
43.1 |
| David Cameron |
Witney |
Conservative |
43.1 |
MPs with support of less than 20 per cent of the electorate, 2010
| MP |
Constituency |
Party |
Electorate % |
| Austin Mitchell |
Great Grimsby |
Labour |
17.6 |
| Jackie Doyle-Price |
Thurrock |
Conservative |
18.3 |
| William McCrea |
Antrim South |
DUP |
18.3 |
| David Simpson |
Upper Bann |
DUP |
18.7 |
| Simon Wright |
Norwich South |
Liberal Democrat |
19.0 |
| Gregory Campbell |
Londonderry East |
DUP |
19.1 |
| Alan Johnson |
Hull West & Hessle |
Labour |
19.4 |
| Phil Woolas |
Oldham East & Saddleworth |
Labour |
19.5 |
Conclusion
The link between constituency and MP, often cited by supporters of the current system as a benefit of FPTP, has clearly changed, not just since the high point of the two party system in the 1950s, but also since the 1990s. The normal pattern is now for two MPs out of every three to lack the support of a majority of local voters, and an increasing number not to reach 40 per cent support. No MP returned in any of the last three elections has had the support of a majority of the local electorate.
The debate over the possibility of moving to the Alternative Vote (AV) was fuelled by the low proportion of MPs with a majority mandate in the 2005 parliament, and this factor has grown rather than receded as a result of the election of 2010.
‘Wasted’ votes in 2010
Wasted Votes
In any electoral system, there are a certain number of votes that do not contribute to electing a member of parliament – even in highly proportional list systems a few votes will be cast for minority lists that do not gain any representation. These are ‘wasted’ in the sense that they do not affect the outcome in terms of seats. In nearly every circumstance there will also be some votes that are given to candidates who end up not needing them – that are surplus to the requirement of getting elected. These votes, too, in a sense, are ‘wasted’ by the system.
In the 2010 election, over half of those who voted failed to elect their chosen candidate and their vote therefore did not contribute to sending anyone to Parliament. The FPTP electoral system is based on the principle of localised winner takes all and there
is no compensation for the voter whose constituency vote was not cast for the successful candidate. In addition, many seats are safe in the sense that one party or other has a large and reliable majority. In these seats, even those who vote for the winner may be dissatisfied with the power that they have exercised, because giving someone a majority of 10,001 rather than 10,000 may feel less of a contribution than securing a win in a closely-contested election. In terms of actually affecting who sits in Parliament, therefore, many votes are ‘wasted’.
The notion of a ‘wasted’ vote is one that needs some clarification. The term seems to carry an unfortunate, and unintended, negative connotation about the voter’s choice, while in fact it is just mechanically descriptive of the way the vote is processed by the electoral system.
- No vote is really ‘wasted’ if that vote serves as a statement of what the voter believes – her support for a party, a person, a policy – or just a statement of belonging to a democratic community.
- ‘Wasted’ votes count towards national and sub-national vote shares. Although these
are not recognised by the electoral system, they play some part in political discourse. For instance, a Conservative vote cast in Liverpool in 2005 was wasted in the normal sense, but it also contributed to the narrow margin by which the Conservatives won the most votes in England and therefore to strengthening the party’s position.
- Votes that are ‘wasted’ in one election can be consequential in the next; votes cast for losing candidates can create momentum
that is reflected in the strategic choices of the parties, the views of voters and the result in the next election. A Liberal Democrat voter in Burnley in 2005 did not see his support elect an MP that time, but that vote helped establish the party as the clear competitor for the next election and thereby the environment that produced a Lib Dem gain in 2010.
- The position is a bit different in marginals and safe seats – in a safe seat, the voter can tell pretty well ex ante whether her choice will be to support a losing candidate or add to a winning candidate’s surplus. In marginals, the vote might turn out to be ‘wasted’ (for a loser), to form a part of a relatively small winner’s surplus, or perhaps even to be the decisive margin of victory. Voting for a potential winner in a marginal is therefore a bit like buying insurance – it is not wasted, even if the policy does not pay off on that occasion.
Votes in 2010 election
So, with these reservations about the term ‘wasted vote’, how many votes in the 2010 general election were either for losing
candidates (and therefore not translated into seats) or were surplus to those necessary to ensure a candidate was elected?
The majority of votes, 52.8 per cent, were cast for losing candidates and therefore did not contribute to electing MPs. Taking votes that ended up being surplus to winners’ requirements, the proportion of votes wasted or partially wasted by the system was 71.1 per cent.
This share is not unusual for the First Past the Post system as it operates in a multi-party context. In 2005 the corresponding shares of the vote were very similar, with 52.4 per cent of votes cast for losing candidates, 29.3 per cent being necessary for winners, and 18.3 per cent forming surpluses for winners.
Votes cast for losing candidates have been consistently more or less 50 per cent since February 1974, although the 2010 share is the highest in recent years.
The proportion of votes cast for losing candidates, or being surplus to winners’ requirements, is much higher under FPTP than in most other electoral systems.
Share of vote for losing candidates 1974-2010
Gender and ethnic representation
Women: House of Commons
The overall number of women in the House of Commons after the 2010 general election rose to another historic high of 143 out of 650 seats. Since the election, the result of the Oldham East & Saddleworth by-election has nudged the figure up to 144. The proportion of women in the Commons now stands at 22.0 per cent, compared to 19.5 per cent in 2005. This has placed the UK slightly higher up the table of women’s representation in parliaments worldwide – 52nd place. However, Britain still trails far behind Rwanda, which is in first place with women’s representation at 56.3 per cent.
Britain also remains behind most Western European parliaments, which tend to have proportional electoral systems. It has been
estimated that at the current rate of change and under the current system it will take a further 200 years before we reach parity in the numbers of women and men in parliament.
| Election Year |
Number of women MPs |
% of Women MPs |
| 1979 |
19 |
3 |
| 1983 |
23 |
3.5 |
| 1987 |
41 |
6.3 |
| 1992 |
60 |
9.2 |
| 1997 |
120 |
18.2 |
| 2001 |
118 |
17.9 |
| 2005 |
128 |
19.5 |
| 2010 |
143 |
22 |
In 2005 three quarters of all female MPs represented the Labour Party; advancing observations that the level of women’s representation in the Commons was largely
dependent on Labour’s majority. Concerns were raised that the number of women in parliament could potentially decline if another party dominated in future elections, unless the proportion of women became more uniform across the parties.
Nevertheless, despite Labour losing its majority in the 2010 election, the number of women
in parliament has not decreased; although the composition of the lower chamber has changed. The House of Commons is now composed of more Conservative women and fewer Labour and Liberal Democrat women than in 2005.
| Party |
Number of Women MPs |
Increase /decrease from 2005 |
Proportion of parliamentary party |
| Labour |
81 |
-13 |
31.4 |
| Conservatives |
49 |
31 |
16 |
| Liberal Democrats |
7 |
-2 |
12.3 |
| Other |
6 |
– |
– |
High numbers of retiring MPs provided the opportunity for the three main parties to make real progress on women’s representation
in the 2010 election. Both Labour and the Liberal Democrats have achieved a rate of 50 per cent women as candidates in seats
with retirements. In total 152 male and 28 female MPs retired and they were replaced as candidates by their parties with 87 men and
65 women.
The Conservatives have increased their number of women by thirty, which is a significant increase compared to 2005 (a percentage increase from 8.6 to 15.7). Both Labour and the Liberal Democrats have lost female MPs from their ranks – thirteen and two respectively. However, since the overall number of Labour MPs has fallen, this means the proportion of female Labour MPs has increased from 27.5 per cent to 31.4 per cent. Although Labour has lost thirteen women, the party remains far ahead of the other parties in its proportion of women MPs. On the other hand, the Liberal Democrats appear
to be going backwards in terms of women’s representation; whereas in 2005 female Liberal Democrat MPs made up 16.1 per cent of the parliamentary party, in 2010 this has decreased to 12.3 per cent.
Despite an increase in the number of Conservative women, Labour still managed to retain the highest number of female MPs. There are two main factors behind the high number of Labour women: the party placed more women candidates in winnable seats; and they placed a large number of women candidates in safe seats where the previous Labour MPs was standing down.
Six female MPs were elected from the smaller parties – 1 for the Green Party; 1 for Sinn Fein; 1 for the SNP; 1 for the SDLP; 1 Independent; and 1 for the Alliance Party.
Women: party representation
There were 877 women out of a total of 4,134 candidates in the 2010 general election. Although this figure was higher than in previous elections, it still only amounted to 21 per cent of the total number of candidates.
It is logical to expect that a higher number of female candidates will translate into a higher number of women MPs and the recent general election has been no exception to this logic. In 2001 women made up 19 per cent of the total number of candidates; in 2005 this rose to 20 per cent; and in 2010 this increased again to 21 per cent, which resulted in the 2010 election producing the highest number of women MPs in the UK to date.
| Party |
No. of women candidates |
Proportion of total party candidates |
Number of women MPs |
| Labour |
190 |
30.3 |
81 |
| Conservatives |
152 |
24.1 |
48 |
| Liberal Democrats |
134 |
21.3 |
7 |
However, there are several explanations why the number of women candidates did not convert into more women MPs. First,
although selection processes aim to increase the number of female candidates, in order to significantly increase the number of women in parliament under the First Past the Post (FPTP) electoral system these candidates need to be placed in winnable seats. For example, if we take a look at the disproportional number of Liberal Democrat women MPs compared to the number of Liberal Democrat women candidates this indicates that a large number of these candidates were not placed in winnable seats. Secondly, in seats that are contested between female candidates, this places significant limits on the number of women who can be elected. For example, Bolton West saw Julie Hilling, Jackie Pearcey and Susan Williams all contesting the same seat and Brighton Pavilion saw Caroline Lucas, Nancy Platts, Charlotte Vere and Bernadette Millam all standing. In total there were 11 seats around the UK where candidates from the three main parties were all women, whereas in 262 seats the candidates from the main parties were all men.
The Sex Discrimination (Election Candidates) Act 2002 allowed political parties to use positive action in the selection of election candidates, should they wish to do so. This Act has now been amalgamated into the Equality Act 2010, which extends the provision to exempt political parties from sex discrimination law until 2030. For Westminster elections, Labour is the only party to use this provision and the policy of all-women shortlists has remained important in addressing the gender imbalance in the Parliamentary Labour Party.
The marked increase in the number of Conservative women MPs – although not due to the use of all-women shortlists – can be attributed to a determined effort by the Conservative Central Parliamentary Selection Board to place more women on their list of candidates, combined with a national swing towards the Conservative party.
The Liberal Democrats also do not use all-women shortlists in their selection process. However, the Campaign for Gender Balance (formerly the Gender Balance Task Force) provides training, mentoring and practical support to women candidates with the aim of increasing the number of women candidates in the party, and the number of those selected for winnable seats.
The three main parties have adopted different approaches to candidate selection, each having a different impact on the number of women candidates standing in the 2010 general election. The Speaker’s Conference on Parliamentary Representation (January 2010) welcomed the efforts made by the main parties to ensure that local selection procedures were more objective and professional, yet the report noted that it still remains more difficult for a candidate who does not fit the ‘white, male, middle-class’ norm to be selected. Under the FPTP system, sustaining progress and increasing the number of women in parliament is heavily dependent on the commitment of the individual parties to gender equality.
Women: regional variations
The number of women elected varied widely across the English regions. The North East region has the highest proportion of women – 10 out of 29 MPs (34.5%). It can be observed that the majority of seats in the North East were won by Labour, indicating that perhaps this is an area where the party’s policy of all- women shortlists for safe seats has returned a higher than average level of women to Westminster. In comparison, the region with the lowest proportion of women is the East of England – 9 out of 58 MPs (15.5%). The table below outlines the full regional breakdown of women MPs in each region.
The proportion of women elected in Scottish constituencies has increased. In the new parliament, 13 out of 59 Scottish constituencies are represented by a woman, a rate of 22 per cent. This is a rise of 6.7 per cent from 2005, where only 9 women were elected out of 59 constituencies in Scotland. The number of women returned to Westminster by Scottish voters is in stark contrast to the representation of women in the Scottish Parliament, which stands at a
much higher 33.3 per cent, achieved through a combination of proactive measures by the parties and a more proportional electoral system.
| Region |
Total number of seats |
Number of women MPs |
% women MPs |
| East of England |
58 |
9 |
15.5 |
| East Midlands |
46 |
11 |
23.9 |
| Greater London |
73 |
24 |
32.9 |
| North East England |
29 |
10 |
34.5 |
| Northern Ireland |
18 |
4 |
22.2 |
| North West England |
75 |
16 |
21.3 |
| Scotland |
59 |
13 |
22 |
| South East England |
84 |
14 |
16.7 |
| South West England |
55 |
11 |
20 |
| Wales |
40 |
7 |
17.5 |
| West Midlands |
59 |
13 |
22 |
| yorkshire & Humber |
54 |
10 |
18.5 |
Women were elected in 7 seats out of a total 40 constituencies in Wales. This represents 17.5 per cent of the total number of Welsh MPs, the same proportion as in 2005. As with their devolved Scottish counterparts, this figure is far behind the representation of women in the Welsh Assembly (46.7 per cent), which also elects members via a more proportional system.
Interestingly, the majority of women elected in Scotland and Wales were from the Labour party – 11 and 6 respectively – suggesting that Labour has done more to increase women’s representation in these areas than any other party.
Northern Ireland has increased the number of women elected to Westminster from three to four. These four women were all elected from different parties – Sinn Fein, Alliance Party, SDLP, and one Independent. Out of a total 18 MPs in Northern Ireland, the election of these women account for 22.2 per cent. Comparatively, the proportion of women in the Northern Ireland Assembly, elected under the single Transferable Vote stands at 15.7 per cent (17 out of 108 seats). Although the Northern Ireland Assembly has a lower proportion of women in comparison to the number of women elected from the region to Westminster, the main reason for this result is the low numbers of female candidates put forward by the largest parties. The Democratic Unionist Party, Sinn Fein, and the Ulster Unionist Party stood a total of 16 female candidates out of 118 in the 2007 Assembly election. It can be argued that given the low number of women candidates, the Single Transferable Vote system actually served to boost the numbers of women elected to the Assembly.
Black and ethnic minority representation
The 2010 election saw a significant increase in the number of Black and Minority Ethnic (BME) MPs from 14 to 26, making up 4.0 per cent of the new Parliament. yet this figure is not reflective of wider society where people from minority ethnic backgrounds make up nearly 10 per cent of the UK population and therefore the current level of representation is still inequitable.
| Election year |
Number of BME MPs |
% of BME MPs |
No. of women BME MPs |
| 1987 |
4 |
0.6 |
1 |
| 1992 |
6 |
0.9 |
1 |
| 1997 |
9 |
1.4 |
2 |
| 2001 |
12 |
1.8 |
2 |
| 2005 |
15 |
2.2 |
2 |
| 2010 |
26 |
4 |
8 |
Women from BME backgrounds did particularly well in the 2010 general election. There are now 8 female MPs of black and ethnic minority origin. This is a fourfold increase on the 2005 Parliament where there were only 2 female BME MPs. Before 2010, only three BME women had ever sat in the Commons – Diane Abbott (1987- ), Oona King (1997-2005) and Dawn Butler (2005-
10).
There were over 130 BME candidates in the 2010 election, which is the highest number yet to stand in a UK general election. The Labour party has increased its total number of ethnic minority MPs by two to 15 (six women and eight men) making up 5.8% of the parliamentary Labour party.
The Conservatives have also boosted their number of BME MPs in this election; there are now 11 Conservative MPs from black
and minority ethnic backgrounds (two women and nine men), an increase of 9 from the last parliament. The Liberal Democrats whilst fielding a record number of BME candidates did not achieve success in electing any of these candidates.
The election has also produced several historic firsts in terms of BME representation. The first three female Muslim Labour MPs were elected – Shabana Mahmood in Birmingham Ladywood; yasmin Qureshi in Bolton South
East; and Rushanara Ali, also the first MP from Bangladeshi origin, in Bethnal Green &Bow. Priti Patel was elected to the seat of
Witham and became the first female Asian Conservative MP.
In Maidstone and Weald, Helen Grant became the first female black Conservative MP and Dr Chinyelu Susan Onwurah, in Newcastle upon
Tyne Central, was elected as the first female MP of African heritage.
Representation in the cabinet
The new coalition government under David Cameron and Nick Clegg has failed to place more women in the cabinet. Out of 23 cabinet members, only 4 women have been appointed. These women are: Theresa May – Home Secretary and Minister for Women and Equality; Caroline Spelman – Environment, Food and Rural Affairs; Cheryl Gillan – Welsh Secretary; and Baroness Warsi – Minister without Portfolio and Conservative party chair. Baroness Warsi has also made history by becoming the first Muslim woman to serve in the cabinet. However, none of the Liberal Democrat appointments to the cabinet are women.
The UK is behind other European countries when it comes to women’s representation in politics, and especially women in the cabinet. The table below gives an overall comparison of women’s representation in the lower houses of European countries.
| Party |
Number of BME MPs |
Increase / decrease from 2005 |
Proportion of parliamentary party % |
Number of women BME MPs |
| Lab |
15 |
2 |
5.8 |
6 |
| Con |
11 |
9 |
3.6 |
2 |
| Lib Dem |
0 |
No change |
0 |
0 |
Female representation in European lower houses
| Rank |
Country |
Last Election |
% in |
| 1 |
Sweden |
Sep-10 |
45.00% |
| 2 |
Netherlands |
Jun-10 |
40.70% |
| 3 |
Finland |
Mar-07 |
40.00% |
| 4 |
Belgium |
Jun-10 |
39.30% |
| 5 |
Denmark |
Nov-07 |
38.00% |
| 6 |
Spain |
Mar-08 |
36.60% |
| 7 |
Germany |
Sep-09 |
32.80% |
| 8 |
Austria |
Sep-08 |
27.90% |
| 9 |
Portugal |
Sep-09 |
27.40% |
| 10 |
Estonia |
Mar-07 |
22.80% |
| 11 |
United Kingdom |
May-10 |
21.80% |
| 12 |
Italy |
Apr-08 |
21.30% |
| 13 |
Bulgaria |
Jul-09 |
20.80% |
| 14 |
Luxemburg |
Jun-09 |
20.00% |
| 15 |
Poland |
Oct-07 |
20.00% |
| 16 |
Lithuania |
Oct-08 |
19.10% |
| 17 |
Latvia |
Oct-10 |
19.00% |
| 18 |
France |
Jun-07 |
18.90% |
| 19 |
Greece |
Oct-09 |
17.30% |
| 20 |
Czech Republic |
May-10 |
15.50% |
| 21 |
Slovakia |
Jun-10 |
15.30% |
| 22 |
Slovenia |
Sep-08 |
14.40% |
| 23 |
Cyprus |
May-06 |
14.20% |
| 24 |
Ireland |
May-07 |
13.90% |
| 25 |
Romania |
Nov-08 |
11.40% |
| 26 |
Hungary |
Apr-10 |
9.10% |
| 27 |
Malta |
Mar-08 |
8.70% |
The marginal seats
The strategy
A common factor in British elections is that the majority of seats can be described as ‘safe’ for one party or another. The number that are seriously contested between the parties, and thereby decide who is in government, number around 200 out of 650 at a rather generous estimate. Of particular importance in 2010 were the 116 seats that the Conservatives needed to gain to achieve a bare majority in parliament. The problem for the Conservatives in winning these seats was that the swing required was very high – 7 per cent from all other parties, and 8 per cent if only from Labour. A 7 per cent swing would imply a Conservative lead over Labour of 11 percentage points, pretty much what they achieved in their landslide win in 1987. A national swing of sufficient size has only occurred in three elections: 1931, 1945 and 1997. An alternative to winning such a large national swing was to devise a political strategy to obtain a higher than average swing in the marginal seats. This would consist of several dimensions. 1. Targeting of resources. This would consist of the strategy piloted by Lord Ashcroft in selected seats before 2005, rolled out across the whole field of marginal seats. Candidates would be selected early in the parliament and money would be devoted to funding local campaigning, getting the candidates known and establishing a party infrastructure. This would be augmented by centrally-provided resources such as telephone canvassing backed up by demographic research. There was a conscious aim to counteract the benefits of incumbency, which had been so apparent for Labour MPs in the elections of 2001 and to some extent 2005. 2. Policies tailored to the swing voters in the marginal seats and market-tested with them through focus group and other research; reassurance over the public services that were important to them, and a change of tone. 3. A political strategy that reduces the incentives for anti-Conservative tactical voting. By ‘decontaminating’ the Conservative brand, and making Lib Dem (and to a lesser extent Labour) supporters fear the party less, the Tories would make opposition voters less determined to stop them. This underlay the period of going against type, on environmentalism and social concern, that was strong in the projection of the party in Cameron’s first year. This would encourage ‘tactical unwind’ to take place, i.e. for there to be a particularly strong net swing to the Conservatives in places where tactical voting had taken place before (i.e. the marginals). David Cameron said in his 2007 party conference speech about Gordon Brown: “Boy has this guy got a plan. It’s to appeal to that 4% of people in marginal seats. With a dog whistle on immigration there and a word about crime here, wrap yourself up in the flag and talk about Britishness enough times and maybe, just maybe, you can convince enough people that you are on their side.” (Text at http://news.bbc.co.uk/1/hi/7026435. stm) This may have been entirely accurate about his target, but it was also a piece of projection: Cameron too needed to appeal to exactly the same set of voters, using the same tools as Brown, because of the role that swing voters in marginal seats play within the British electoral system. The Conservatives therefore focused their strategy on the marginal seats with a concentration that exceeded previous targeting efforts. Labour, of course, devoted a large part of its smaller resources into defending these seats, and the Liberal Democrats also focused on the seats where the effort could make the difference between winning and losing.
The outcome: safe seats were... safe
The marginal seats were once again the decisive element of the general election. The result in most ‘safe’ seats was that which could be easily predicted from the size of their majorities in 2005 and a knowledge of national trends. There were very few exceptions – these are listed in the table below. The Conservatives in Hampstead & Kilburn also deserve an honourable mention for falling only 42 votes short of gaining the seat from third place, despite its lowly 226th place on their target list, as do the Lib Dems in Hull North, where a swing of 12.2 per cent was not quite enough to overturn Labour’s majority in the Lib Dems’ 180th target. Only three seats in Great Britain that changed hands required a swing of more than 10 per cent – Cannock Chase, Montgomeryshire and Redcar. In Cannock, Harrogate, Winchester and the special circumstances of Norwich North, the high swing accompanied the retirement of an incumbent MP. This suggests that even in an election such as 2010 where there was wide variation in the size of the swing, parties could take the bulk of seats for granted – there are 207 Labour seats outside the 8 per cent swing range, of which three were lost, a mortality of around 1.5 per cent even in an election when the Labour vote dropped sharply. Of the 210 notionally Conservative seats, the mortality rate was only slightly higher, with two genuine losses to the Lib Dems in seats with small majorities (Eastbourne and Wells) and one seat that was won by the Lib Dems in 2005 but had a tiny notional Tory majority after boundary changes (Solihull).
‘Non-marginal’ seats changing hands in 2010, in rough order of implausibility
| Constiuency |
2005 |
2010 |
Party target number |
% majority in 2005 |
| Belfast East |
DUP |
Alliance |
– |
41.3 (AP third) |
| Redcar |
Lab |
LD |
264.00 |
31.2 |
| Montgomeryshire |
LD |
Con |
210.00 |
22.8 |
| Chesterfield |
LD |
Lab |
37.00 |
7.5 |
| Cannock Chase |
Lab |
Con |
198 |
21 |
| Harrogate & Knaresborough |
LD |
Con |
156.00 |
16.2 |
| Oxford West & Abingdon |
LD |
Con |
130.00 |
13.4 |
| Norwich North* |
Lab |
Con |
162 |
16.6 |
| Winchester |
LD |
Con |
122.00 |
12.7 |
| Brent Central* |
Lab |
LD |
86 |
19 |
The outcome: targeting made only a ‘marginal’ difference
One of the more surprising aspects of the 2010 result is that the much-anticipated Conservative over-performance in the marginal seats failed to happen, or happened to only a tiny degree.
The following chart shows the swing from Labour to Conservative in different categories of seat, according to their status in 2005.
At first glance, this seems to show that there was a substantially larger swing in the closest marginals (6.2 per cent compared to 5 per cent nationally), but this is not the outcome that was the aim of the strategy. The reason
is that the top 50 seats would all have gone with a much smaller than average swing, of a bit over 3 per cent – getting a good result here was superfluous. Where a bigger swing was needed was in the seats just after the 100th target, where it really would make the difference between a parliamentary majority and a hung parliament. The swing at this level of marginality was actually lower than average, at 4.8 per cent. The Conservatives also obtained a high swing in the seats they already held in 2005 (6.1 per cent). The pro-Conservative swing ended up being, from the point of view of their hopes of winning a majority, a bit maldistributed rather than efficient.
The upshot of this pattern of swing is that there was very little change to the extent of electoral bias in the 2010 election. The
Conservatives are still in need of, if one applies uniform swing, something like an 11-point lead for an overall majority, just as they did on the electoral geography of 2005. Labour could regain a majority with a 4.6 per cent swing from other parties, i.e. a popular vote lead
of around 2 points, which is a bit more than required on 2005’s distribution of the vote. The question of electoral bias is addressed elsewhere, but the Conservatives’ attempt to reduce it by political strategy and targeting in 2010 seems to have failed.
Swing % 2010
Several reasons may be suggested for this unexpected result. One centres around the television debates and their impact on the dynamic of the campaign. The targeting strategy had aimed to create a campaign environment in the marginals, which pitted a locally known Tory candidate as the standard bearer of change against ‘Gordon Brown’s candidate’. The debates cut across this message, because Clegg was able to project the Lib Dems as an equally plausible option for change, and the sort of people who had been won over by local targeting were weakly attached to party politics and susceptible to the ‘nationalisation’ of the campaign and Clegg’s message. This analysis has been publicly attributed to Lord Ashcroft. Another possibility is that at a late stage Labour managed to find a formula to counteract the Conservative strategy. Anecdotally, after a collapse in party activism in 2008 and 2009, morale started to recover in late 2009 and this may have been reflected in a greater than expected level of Labour grassroots activity in the marginals. The impact of energetic incumbent MPs may also have been underestimated, particularly in the context of the 2009 expenses scandal, and when it came to the vote, the high quality of constituency service offered by many marginal MPs was rewarded by their electors. ‘Abandon’ indicates marginal seats defended by Labour where there was no incumbent; ‘stay and fight’ are seats that were defended by incumbents. In seats where Labour incumbents stood and fought, the swing in 2010 was barely over the national average, while in those with no incumbent it was significantly better than average (2 per cent over national average, 1.1 per cent over marginals average). Further testament to the power of incumbency was that Conservative MPs who gained their seats in 2005 benefited from a swing that was well over average (3.2 per cent over national, 2.1 per cent over the average for Tory seats).
Swing % 2010
The apparent low bonus for the Conservatives in the marginals may also reflect a complex set of cross-currents. It is notable that the Conservatives managed to win a number of marginal seats consisting of a single town, which are sometimes a class of seats that is resistant to national swings (the histories of places such as Gloucester, Waveney and Ipswich illustrate this). The campaign strategy may have been able to neutralise incumbents’ ability to damp down national swings in this sort of seat. The issue will require further research with more precise data at the constituency and national level.
The Liberal Democrats: more votes, fewer seats
Although the Liberal Democrats’ vote share in 2010 was a point higher than in 2005 (23 per cent, up from 22 per cent), their number of seats fell from 62 to 57. Their vote share was a lot lower than expected, and for them to be actually losing seats came as a big surprise on election night given their seemingly strong campaign. This apparently perverse outcome happened because the Liberal Democrat vote suddenly became a lot less efficiently distributed than it had been in the last three elections. Their breakthrough from 20 to 46 seats in 1997 came alongside a fall in their national vote share because they had been effective in targeting the seats they might gain, and this came undone a bit in 2010. Had the voting trends in seats of Liberal Democrat interest just followed the national trends, they would have suffered a small 1.4 per cent swing to the Conservatives (whose support increased more than theirs) and lost seven seats. The national swing from Labour to Lib Dem, however, was 3.6 per cent. This should have toppled 7 Labour seats, leaving the Lib Dems steady on 62. However, their performance in the marginal seats was uneven and generally poor. They missed every single one of the Labour seats they ‘should’ have gained, but hung on in four of the seven Tory targets and scraped three gains from the Conservatives against the trend (Eastbourne, Wells and a hold in Solihull where boundary changes would have made it a Tory seat in 2005). The Liberal Democrat vote never seems to move regularly – while there was stasis in the most marginal seats, there were dramatic movements in other seats that apparently had large Lib Dem or Labour majorities in 2005 but still changed hands. The Liberal Democrats’ rising vote share reflected a general levelling-up of the party’s support, which was probably caused by the leader debates ‘nationalising’ the campaign, where previously Lib Dem votes were generally won by energetic candidates and local targeted campaigning. But alongside this seems to have gone a levelling-down in some of their existing strongholds.
Electoral system bias
Bias
The primary bias in the electoral system is the under-representation in seats, compared to their share of votes, of the Liberal Democrats and other smaller parties whose support is broadly spread. The Liberal Democrats received 23 per cent of the vote, and only 8.8 per cent of seats. This is a systematic property of the FPTP electoral system, demonstrated again and again in UK election results. However, there is another form of electoral system bias that has attracted some attention in recent years. In a predominantly two party system, FPTP can be rationalised as allowing proportionality of power in that the two principal parties periodically exchange power based on relatively small swings in votes. This argument is weakened if the relationship between votes and seats is not symmetrical for the large parties – if, for instance, one party needs a much larger lead in the popular vote to win a majority than the other. Even at the height of Britain’s two party system in the 1950s, there was a bias in the system whereby if the parties polled the same number of votes, the Conservatives would have more seats. This was apparent in the election result in 1951, when the Conservatives won a majority of seats even though Labour had more votes, and the contrast between 1950 and 1955 when similar popular vote leads (2.6 per cent and 3.3 per cent respectively) produced an unworkably narrow majority for Labour in 1950 but a comfortable Tory win in 1955. The principal reason for this was the way the parties’ votes were distributed, with Labour piling up vast majorities in its working class, particularly mining, strongholds, and the Conservatives winning suburbs and country areas less overwhelmingly. This form of system bias disappeared in the 1960s (partly because it was offset by the tendency of constituency size bias to increasingly favour Labour between the boundary changes of 1955 and 1974) and it was more or less level between the two parties for a while (although even so, Labour won more seats but fewer votes than the Conservatives in February 1974). However, an anti-Conservative bias set in at the 1992 election, largely a result of tactical voting (with some assist from constituency size), meaning that a 7.6 per cent lead in vote share was only just sufficient for an overall majority. Tactical voting in the elections of 1997 and 2001, where there was a sense of a loose progressive alliance between Labour and Lib Dem, was even more prevalent and despite the deteriorating relations between the parties at Westminster and the breach over Iraq, it did not seem to fall much in 2005.
System bias in 2010
On uniform swing assumptions, the Conservatives need a further swing of just below 2 per cent to obtain an overall majority – i.e. a lead of 11 points over Labour, which was what they required on the electoral geography of 2005. Labour requires a swing of around 1.9 per cent to become the largest single party and 4.8 per cent for an overall majority. The electoral system bias is somewhat less than in 2005, perhaps mostly because of the effect of the small Conservative over-performance in the marginals and the higher turnout.
| % Con lead required for… |
2005 old boundaries |
2005 new boundaries |
2010 |
| Labour overall majority |
+1.1 |
+0.3 |
-2.8 |
| Level seats |
+6.5 |
+5.7 |
+3.3 |
| Conservative overall majority |
+11.9 |
+10.9 |
+11.0 |
The bias in the two party contest towards Labour and against the Conservatives has therefore lessened – no longer does uniform swing project a Labour majority despite a Conservative lead in the popular vote. However, the target for the Conservatives to win outright is still just as high – it is that the electoral geography of 2010 makes it more difficult for Labour to win an overall majority. Given that incumbency seems to play a strong role in constituency outcomes, the uniform swing figures may understate the scale of Labour’s task because Conservative MPs who displaced Labour incumbents in 2010 will receive an incumbency bonus in 2015. Ironically, the radical boundary review that forms part of the coalition programme may significantly undercut this bonus because redistribution weakens the personal votes for incumbents by bringing areas they have not represented into the constituency and taking out established supporters.
But the reduction in bias is fairly small and despite two sets of constituency boundary changes and the reduction of Scottish representation the Conservatives are still in a worse place with the electoral system than they were in 1992. In that election, a lead of 7.1 percentage points (i.e. what they had in 2010) would have meant a majority of 11 rather than a minority position.
This chapter explores the reasons for bias – two readily measurable quantities (constituency-level differential turnout, and third party seats), and one less specific factor (vote distribution, including tactical voting). But before addressing these, one needs to get the much-hyped and misunderstood question of constituency size out of the way.
Size doesn’t matter (much)
Constituency size is a pretty small contributor to the overall pro-Labour bias in the electoral system, and what there is can be attributed in large part to the small size of Welsh constituencies.
Taking Britain as a whole, the average Labour seat is about 2,000 electors smaller than the standard size of a constituency, and the average Conservative seat about 2,000 electors larger. These are not large discrepancies, at 2.7 per cent above and below the average, and politically of little consequence. If, and this is a highly artificial exercise, one could magic into existence constituencies to make both Labour and Conservative seats conform exactly to the British average, this would mean adding 8 seats to the Conservatives and taking 7 away from Labour.
The average constituency is a bit smaller in Scotland than in England, despite the equalised basis on which they have been allocated. This is for two reasons – allowance is made for the particular difficulties of Scottish Highland and Island geography, and because the numbers of registered electors have declined in the big city areas of Scotland. The average Scottish Labour seat, though, is only 919 electors smaller than the average British Labour seat, suggesting that Scotland’s over-representation is not a huge issue in overall electoral system bias. If the Conservatives had done better in Scotland (for instance, if their hopes of winning 11 seats had come off) this source of bias would have been reduced even further.
| Mean electorate |
All seats |
Con seats 2010 |
Lab seats 2010 |
LD seats 2010 |
| Great Britain |
70,312 |
72,231 |
68,423 |
69,725 |
| England |
71,917 |
72,699 |
70,173 |
72,638 |
| Scotland |
65,499 |
66,627 |
67,504 |
61,559 |
| Wales |
56,070 |
55,571 |
57,136 |
57,91 |
The Conservatives did gain ground in Wales in 2010, and the small size of Welsh constituencies is a factor in size differences
between the parties. The 8 Conservative MPs from Wales actually tend to represent rather fewer electors each (879) than the 26 Welsh Labour MPs. Tory success in Wales therefore reduced this source of intra-party difference a bit, but with Welsh Labour providing 10 per cent of the Parliamentary party this drags the average size of Labour seat down a bit more than 8 Tories among 306. The over- representation of Wales is one that may be
justifiable at present given the need to protect the interests of a smaller nation in a devolved state in which the majority-English national legislature retains such extensive powers over Wales, but it is certainly worth revisiting as devolution proceeds.
In England, the average Conservative seat is 1.4 per cent (1,003 electors) over the English standard size, and the average Labour seat 2.4 per cent undersized (1,744 electors), a very small differential. This is worth 3 more Tory seats and 5 fewer Labour seats, again hardly the vast disparities that some politicians and commentators profess to believe in.
Nor is this pattern particularly new. What has tended to happen is that the size gap increases the older the constituency boundaries are, and elections just before a boundary review took effect were particularly biased in this size respect in 1970, 1979 and 1992. Boundary reviews tend to correct for size, but not completely – partly for structural reasons and partly because they tend to
use old data. The reduction in Scottish representation in 2005, and the boundary changes in the rest of the UK in 2010, actually produced the smallest size differential between Conservative and Labour seats of any election since 1959.
The problem lurking in the background is that all these numbers are based on registered electors. The number on the electoral register in a constituency is not a stable figure. It rises and falls with genuine population movements, the electoral cycle (it now being possible to join the register a lot later than previously possible during an election campaign) and administrative decisions. The introduction of Individual Electoral Registration (IER) will, if Northern Ireland’s experience is anything to go by, make the registered electorate a more volatile number than it has been until now.
The main administrative factor is that some people who are qualified to vote are easy to find, and some are not. If a person lives in a whole house (rather than a flat), has lived there several years, and has English (or Welsh) as their first language, they are likely to be very easy to get on the register. If someone is young, has moved recently, lives in a rented subdivided house, or is vulnerable by means of language or learning difficulties, they are going to be difficult to get on to the register. Electoral Commission studies have repeatedly found large scale under-registration, concentrated in the cities (a 2010 study found 75 per cent registration in Glasgow, suggesting that far from being over-represented the city should have one or two more constituencies). If under-registration is a problem in the cities, Labour seats are disproportionately affected.
If electoral registration is 90 per cent complete in Labour seats, and 94 per cent in Conservative seats – as is quite possible,
given the urban concentration of Labour seats – the average English Labour MP in fact has more people qualified to be electors than the average English Conservative MP.
Difference in average constituency electorate by party 1945-2005 Size difference (Con+ Lab-)
Differential turnout in 2010
Differential turnout is a significant contributor to electoral system bias. Turnout in Labour seats is lower than turnout in Conservative seats.
It is possible to quantify the turnout effect by modelling a result in which turnout is equal across every constituency but the parties’ shares of the vote are unchanged (an assumption that is likely to be unrealistic, because the demographic factors that cause low turnout in safe Labour seats are likely also to apply to Labour areas of mixed seats).
Differential turnout therefore accounts for a net bias of 1.7 per cent towards Labour in the relationship between votes and seats – that as far as the electoral system was concerned, the Conservatives’ lead was 5.4 per cent rather than the actual 7.1 per cent.
|
Conservative seats % turnout |
Conservative seats Voters |
Labour seats % turnout |
Labour seats Voters |
Lib Dem seats% turnout |
Lib Dem seats Voters |
| Britain |
68.4 |
49,441 |
61.2 |
41,807 |
67.3 |
46,944 |
| England |
68.4 |
49,691 |
60.5 |
42,431 |
67.6 |
49,067 |
| Scotland |
68.9 |
45,892 |
63.1 |
42,589 |
66.9 |
41,153 |
| Wales |
73.1 |
40,602 |
63.7 |
35,986 |
65.2 |
37,751 |
|
Conservative Vote share on equal turnout % |
Change from actual result% |
Labour Vote share on equal turnout % |
Change from actual result % |
Liberal Democrat Vote share on equal turnout % |
Change from actual result % |
| UK |
35.2 |
-0.90 |
29.80 |
0.8 |
22.7 |
-0.3 |
| Great Britain |
36.1 |
-0.80 |
30.60 |
0.9 |
23.3 |
-0.3 |
| England |
38.7 |
-0.90 |
29.00 |
0.9 |
24 |
-0.4 |
| Scotland |
Jan-00 |
-0.30 |
42.5 |
0.5 |
18.5 |
-0.4 |
| Wales |
25.3 |
-0.80 |
36.70 |
0.5 |
20.3 |
0.2 |
Third-party seats in 2010
Another factor in electoral system bias is that votes cast in seats where neither Labour nor Conservative MPs are elected contribute to the national vote share but not to either party’s share of seats. Taking the Lib Dem, SNP, Plaid Cymru, Green and Speaker seats out of the calculation serves to further reduce the Conservative lead, principally because there are over 400,000 more Tory than Labour
voters in Lib Dem seats. In the seats that sent Conservative or Labour MPs to parliament, the Conservatives polled 37.8 per cent and Labour 31.4 per cent, while in the other 67 seats in Britain the shares were 29.2 per cent and 15.4 per cent respectively. The Tory lead in ‘Con-Lab’ Britain, which is as far as the electoral system is what matters, was 6.4 per cent rather than 7.1 per cent.
Taking the two factors of constituency-level differential turnout and votes cast in third party seats together, the system ‘thought’ the Conservatives had 36.9 per cent and Labour 32.3 per cent – a 4.6 per cent lead rather than 7.1 per cent. This goes a long way towards explaining why there is an apparently large and persistent pro-Labour bias in the electoral system. With this 2.5 per cent ‘tweak’ Labour’s required lead for a majority is 5.3 per cent and the Conservatives’ around 8.5 per cent on uniform swing from the 2010 results. Labour would become the largest single party with a Conservative lead adjusted for differential turnout
and third party seats of around 0.8 per cent, pretty similar to what it was in February 1974. Given differential turnout hardly existed before 1987, and third-party seats were much fewer in number before 1997 (and nearly non-existent before 1974), it is clear that once one takes out these factors there has been no transformation in the functioning of the FPTP system.
Tactical voting and ‘tactical unwind’
The cause of the remaining bias is in small part constituency size (mostly Welsh over- representation) and rather more than this the more elusive factor of ‘vote distribution’. Third- party seats are part of this, because in many seats where Labour did not stand a chance, the party’s supporters voted tactically for the Lib Dems or SNP against the Conservatives – this meant fewer ‘wasted’ Labour votes in those seats and therefore a more efficient
conversion of the remaining Labour votes into seats. There was a disguised element of the electorate whose real first preference was Labour but whose FPTP votes were cast for other parties, which would not have been wholly offset by Conservatives who cast tactical anti-Labour votes. Tories are historically more reluctant to vote tactically – in fact, in the 2010 election the increase in the Conservative vote in the top 25 Lib Dem targets from Labour was 3.9 per cent, a whisker over their national increase (3.8 per cent). Above-average Conservative advances seem to have knocked out the Lib Dems in several seats, including Chesterfield, Rochdale and Oldham East & Saddleworth. The experience of coalition may change these long-held patterns, but on the 2010 arithmetic, Labour supporters’ greater willingness to vote tactically helped to tilt the system a bit in their party’s favour.
The other side of tactical voting is that Labour has received tactical support in the marginal seats from Liberal Democrat (and Green) supporters against the Conservatives in each election since 1992. Before the elections of 2005 and 2010, in each of which Labour’s vote share fell considerably, there was speculation about ‘tactical unwind’ – previous tactical voters returning to their true allegiance because they have been alienated by Labour or are no longer afraid of the Conservatives.
It does not seem to have played a major role, however, in 2010. If the ‘unwind’ hypothesis were correct, one would expect to see above-average increases in the Lib Dem vote and falls in the Labour vote in Labour-held marginals.
The ‘unwind’ pattern seems to happen only in the most marginal Labour constituencies (where it was superfluous to the Conservatives’ needs). It was also absent in these seats, for the most part, when a Labour incumbent stood and fought. Even in Harrow East, target of heavy anti- Labour campaigning by some pro-reform organisations, Labour’s defeat owed nothing to a loss of support to the Lib Dems – there was a large, conventional, swing to the Tories. Where ‘unwind’ clearly did happen was in the seats the Conservatives gained from Labour in 2005. It is reasonable for anti-Conservatives who unsuccessfully voted tactically to defend a Labour MP in 2005 to take a new view in 2010, and assume that as Labour were not going to be regaining these seats this election they might as well vote for their true first preference.
In the constituencies (targets 101-150) that made the difference between the Conservatives being the largest party in a hung parliament and having an overall majority, if anything there seems to have been more pro-Labour tactical voting than there was in 2005 because Labour’s drop was less than average and the Lib Dem vote actually fell. It is surely one of the ironies of the 2010 election that by voting Labour in 2010, these Lib Dem supporters helped create a parliament where their party could govern with the Conservatives.
|
Change in Conservative share % |
Change in Labour share % |
Change in Lib Dem share % |
| Top 50 Lab/Con marginals |
4.5 |
-7.80 |
1.70 |
| Lab/Con marginals 51-100 |
4.6 |
-6.70 |
-0.10 |
| Lab/Con marginals 101-150 |
4.4 |
-5.20 |
-0.60 |
| Lab/Con marginals 151-200 |
3.6 |
-6.10 |
1.50 |
| Top 100 Lab/Con marginals (incumbent) |
4.3 |
-6.20 |
0.40 |
| Top 100 Lab/Con marginals (retire) |
5.2 |
-8.80 |
1.20 |
| Conservative gain in 2005 |
5.2 |
-11.30 |
3.70 |
Conclusion: the inescapability of bias
Single-member district systems simply cannot be reliably engineered to produce a symmetrical outcome between two leading parties. In the four close UK elections since 1918, i.e. with popular vote leads of less than 2 per cent, the ‘wrong’ winner has emerged in three out of four – the party with most seats has in fact been outpolled by another party. Only in 1964 has the ‘right’ outcome occurred – in 1929 and February 1974 the Conservatives won more votes but Labour were the largest party in hung parliaments, and in 1951 Labour won more votes but the Conservatives obtained an overall majority.
The existence of large scale apparent electoral bias in recent elections is closely connected with three phenomena – the class component in turnout, that means Labour pile up fewer votes in its safe seats; the emergence of the Lib Dems and SNP, most of whose seats are former Conservative areas; and tactical voting. The first factor appears to be a long-term socially determined matter; the second is surely here to stay in the long term, and the third is
probably subject to change for political reasons.
The Conservatives’ marginal seat strategy in 2010 was intended to counteract system bias by producing an above-average swing in the
marginals, but it can be regarded as semi- successful at the very best. The next hope is a boundary review, but this too is unlikely to outweigh the structural factors making for pro-Labour bias unless some very partisan lines are drawn on the map. Within the logic of a single member constituency system, there is even a rough and ready logic to the current bias. It arguably allows those who live in deprived low-turnout constituencies to speak on behalf of their neighbours who have the same political preferences but are disengaged from politics; low-turnout elections provide a very skewed picture of a nation or area’s political preferences and single-member districts and bias do adjust for this fact. Bias from third parties and tactical voting is also an indication that for any given ratio of Conservative and Labour votes cast, at least in the politics of 1992-2010, the voters’ broad preferences are actually somewhat more anti- Conservative than appears at first glance.
The possibility of bias is the price for dividing the country into electoral districts. The only realistic way to eliminate bias is to use a PR formula in a single national electoral district. In any discussion of bias, it is also worth raising the question of whether it is reasonable to ‘correct’ a bias between two larger parties when over a third of those voting do not choose either of them and find that the parties they support are the victims of an even stronger structural bias in the electoral system.
Alternative electoral systems
Modelling election outcomes
There are numerous reasons why modelling election outcomes under different electoral systems can be at best an approximate exercise.
The main difficulty with projecting results is that people vote differently under different electoral systems. Under FPTP something like 10-15 per cent of people voted not for the party they really support, but tactically in order to try to vote against a party they did not want to win locally. For this reason, Labour support will be systematically understated in areas where the main fight is between Conservative and Lib Dem (such as Somerset) and similarly for the smaller selection of constituencies where there are different tactical factors. Except in one or two seats, the true level of support for minor parties (particularly Greens and UKIP) is understated as well. A preferential or proportional electoral system will mean vastly lower levels of tactical voting, and therefore different vote shares and patterns of vote distribution for each party. There would be dynamic effects in future because party behaviour would change and there would be lower barriers to entry into political competition.
Different systems would also produce different choices for voters. Under FPTP some parties, particularly the Greens, did not put forward full slates of candidates and some voters therefore did not have the chance to support the party even if they were keen to do so. PR systems will tend to produce a wider range of choice in all areas, and this will affect the votes cast. However, it is difficult to model this effect and this latent support that would appear in reality is not reflected in the model.
Preferential electoral systems involve most voters choosing which candidates they like best in the event that their first preference candidate is unsuccessful (or under STV already elected). These second preferences have to be estimated using opinion polling, which gives a reasonable indication of the broad pattern, but may be misleading in particular areas and constituencies. An MP who is better than his or her party average at attracting second preferences may succeed where the model suggests they would fail (and of course the converse is true).
Some models involve different boundaries, and there are always alternative configurations of boundaries that would create different sorts of political competition and different arithmetic outcomes. Modelling for AV+ is perhaps particularly vulnerable to assumptions about boundaries, but it does affect other systems too. Some estimates of mixed systems involve ‘scaling’ rather than a full working of an – always contestable – alternative boundary scheme.
Precise figures should therefore not be taken too seriously, although they will illustrate the properties of each system.
Regional list proportional representation
|
Con |
Change on FPTP |
Lab |
Change on FPTP |
Lib Dem |
Change on FPTP |
Others |
Change on FPTP |
| EE |
29 |
-23 |
12 |
10 |
14 |
10 |
3 |
3 |
| EM |
20 |
-11 |
14 |
-1 |
10 |
10 |
2 |
2 |
| LN |
26 |
-2 |
28 |
-10 |
16 |
9 |
3 |
3 |
| NE |
7 |
5 |
14 |
-11 |
7 |
5 |
1 |
1 |
| NW |
24 |
2 |
31 |
-16 |
17 |
11 |
3 |
3 |
| SE |
43 |
-31 |
14 |
10 |
23 |
19 |
4 |
2 |
| SW |
25 |
-11 |
8 |
4 |
20 |
5 |
2 |
2 |
| WM |
25 |
-8 |
19 |
-5 |
12 |
10 |
3 |
3 |
| YH |
19 |
0 |
19 |
-13 |
13 |
10 |
3 |
3 |
| England |
218 |
-79 |
159 |
-32 |
132 |
89 |
24 |
22 |
| Wales |
11 |
3 |
16 |
-10 |
8 |
5 |
5 |
2 |
| Scotland |
10 |
9 |
26 |
-15 |
11 |
0 |
12 |
6 |
| NI |
3* |
+3* |
– |
– |
– |
– |
15 |
-3* |
| UK |
242 |
-64 |
201 |
-57 |
151 |
94 |
56 |
27 |
Many list PR systems use a threshold to prevent very small parties gaining representation; a 5 per cent threshold would eliminate minor parties (not, of course, including the SNP, Plaid Cymru and the main Northern Ireland parties) with the exception of Alliance in Northern Ireland. A 2 per cent threshold on the other hand would make relatively little difference to having no threshold at all. No smaller parties would win seats in London (their three seats going instead one each to Conservative, Labour and Lib Dem); the South East would fail to elect a Green (the Conservatives picking up a seat) and UKIP would not win a seat in Yorkshire & The Humber (Labour winning instead).
Local list proportional representation
A fairly common basis for electoral systems in Europe is to divide the country into multi-member constituencies based on counties or similar units and elected using list proportional representation; this is the system in Spain and – with compensating tiers to improve national proportionality – in Denmark and elsewhere.
Compared to list PR on a region-wide level, using a smaller basis for multi-member seats eliminates the seats going to the minor parties in England, and means the two leading parties win slightly more seats.
Mixed Member Proportional (MMP)
|
Con |
Change on FPTP |
Lab |
Change on FPTP |
Lib Dem |
Change on FPTP |
Others |
Change on FPTP |
| EE |
36 |
-16 |
9 |
7 |
11 |
7 |
2 |
2 |
| EM |
21 |
-10 |
14 |
-1 |
9 |
9 |
2 |
2 |
| LN |
26 |
-2 |
28 |
-10 |
16 |
9 |
3 |
3 |
| NE |
5 |
3 |
18 |
-7 |
5 |
3 |
1 |
1 |
| NW |
24 |
2 |
32 |
-15 |
16 |
10 |
3 |
3 |
| SE |
51 |
-23 |
11 |
7 |
18 |
14 |
4 |
2 |
| SW |
25 |
-11 |
8 |
4 |
20 |
5 |
2 |
2 |
| WM |
25 |
-8 |
19 |
-5 |
12 |
10 |
3 |
3 |
| YH |
18 |
-1 |
21 |
-11 |
12 |
9 |
3 |
3 |
| England |
231 |
-66 |
160 |
-31 |
119 |
76 |
23 |
21 |
| Wales |
10 |
2 |
18 |
-8 |
8 |
5 |
4 |
1 |
| Scotland |
9 |
8 |
29 |
-12 |
10 |
-1 |
11 |
5 |
| NI |
2* |
+2* |
|
|
|
|
16 |
-2* |
| UK |
252 |
-54 |
207 |
-51 |
137 |
80 |
54 |
25 |
MMP (sometimes called AMS) aims at combining the single member constituency link of FPTP with an overall proportional outcome. There are two ways of getting elected under MMP – some are elected from constituencies as under FPTP, and then there are members elected from regional or national lists to compensate for the disproportional representation of parties under FPTP. For instance, Labour and the Lib Dems did not win any FPTP seats in Kent, but under MMP the sizeable vote shares for each party would be reflected in Kent having ‘list’ MPs from each party.
MMP is a flexible system, like list PR, that can produce rather different results depending on the precise mix of single-member and list seats. In Germany and New Zealand this is about even, producing a very proportional result (other than disproportionality caused by the 5 per cent threshold); in Scotland and London the ratios are 73/56 and 14/11 respectively, and in Wales the 40/20 ratio produces rather less proportional results. The overall results of a highly proportional MMP system with no thresholds would be nearly identical to those under a list PR system.
A less proportional variant of MMP would mean that the regional biases in representation that one sees under FPTP would not entirely disappear – the Conservatives would retain a certain amount of their preponderance in their strong regions like the South East and Eastern England, and Labour would do so in the North East, North West and Scotland. The following tables are based on a ratio of around 2 constituency seats to 1 list seat in each of the regions and nations, i.e. on Welsh-style MMP rather than the more proportional Scottish or German varieties.
In some regions this involves fairly large numbers of top-up members being elected; if a threshold such as the 5 per cent applied in London were to be introduced, it would prevent the smaller parties from electing list candidates on the votes cast in 2010 (which as noted may not reflect voting behaviour if the system were different – in a number of regions UKIP falls not far short of the threshold).
Alternative Vote (AV)
|
Con |
Change on FPTP |
Lab |
Change on FPTP |
Lib Dem |
Change on FPTP |
Others |
Change on FPTP |
| EE |
46 |
-6 |
6 |
4 |
6 |
2 |
0 |
0 |
| EM |
27 |
-4 |
15 |
0 |
4 |
4 |
0 |
0 |
| LN |
27 |
-1 |
39 |
1 |
7 |
0 |
0 |
0 |
| NE |
1 |
-1 |
26 |
1 |
2 |
0 |
0 |
0 |
| NW |
20 |
-2 |
47 |
0 |
8 |
2 |
0 |
0 |
| SE |
73 |
-1 |
4 |
0 |
5 |
1 |
2 |
0 |
| SW |
31 |
-5 |
4 |
0 |
20 |
5 |
0 |
0 |
| WM |
31 |
-2 |
25 |
1 |
2 |
0 |
1 |
1 |
| YH |
17 |
-2 |
30 |
-2 |
7 |
4 |
0 |
0 |
| England |
273 |
-26 |
196 |
5 |
61 |
18 |
3 |
1 |
| Wales |
6 |
-2 |
25 |
-1 |
6 |
3 |
3 |
0 |
| Scotland |
1 |
0 |
41 |
0 |
12 |
1 |
5 |
-1 |
| NI |
– |
– |
– |
– |
– |
– |
18 |
0 |
| UK |
280 |
-26 |
262 |
4 |
79 |
22 |
29 |
0 |
The Alternative Vote was the proposal that was put to a vote in the referendum on the electoral system. It is not a proportional electoral system, but it does involve preferential voting in single-member constituencies so that all MPs have at least a qualified majority of their voters, unlike FPTP.
Modelling AV does not involve assumptions about new boundaries or making up new electoral units, but it does require assumptions about how preferences flow between supporters of different parties. These are contestable, particularly perhaps in 2010 when the Liberal Democrat share of the vote on election day was so much lower than those in most campaign polls and there were no second preference questions in the exit polls to provide a reliable guide. Projections for individual seats are not to be taken as definitive.
The choices made by voters for one party about their second preferences are not simple or easily read off from national opinion polls (although for the purposes of modelling election results, this is the method one has to adopt). It may well be the case that there are systematic differences between the result modelled and the behaviour of electors under AV, even allowing for the ‘unbundling’ of tactical voting, which the system should produce. For instance, voters may be influenced by the prevailing political culture at the regional level, or even locally – for instance, strong incumbents may do better than their party’s average at attracting second preferences.
Second preferences also change over time, and this is particularly relevant in assessing the impact of the Alternative Vote if the referendum planned for 2011 is passed. The formation of the coalition between the Conservatives and Liberal Democrats after the 2010 election means that many of the political assumptions about second preferences that were relevant as recently as May no longer apply.
Alternative Vote with proportional top-up (AV+)
|
Con |
Change on FPTP |
Lab |
Change on FPTP |
Lib Dem |
Change on FPTP |
Others |
Change on FPTP |
| EE |
40 |
-12 |
5 |
3 |
13 |
9 |
0 |
0 |
| EM |
24 |
-7 |
16 |
1 |
6 |
6 |
0 |
0 |
| LN |
27 |
-1 |
35 |
-3 |
11 |
4 |
0 |
0 |
| NE |
3 |
1 |
23 |
-2 |
3 |
1 |
0 |
0 |
| NW |
24 |
2 |
41 |
-6 |
10 |
4 |
0 |
0 |
| SE |
64 |
-10 |
4 |
0 |
14 |
10 |
2 |
0 |
| SW |
29 |
-7 |
3 |
-1 |
23 |
8 |
0 |
0 |
| WM |
30 |
-3 |
25 |
1 |
4 |
2 |
0 |
0 |
| yH |
22 |
3 |
25 |
-7 |
7 |
4 |
0 |
0 |
| England |
263 |
-34 |
177 |
-14 |
91 |
48 |
2 |
0 |
| Wales |
8 |
0 |
22 |
-4 |
7 |
4 |
3 |
0 |
| Scotland |
3 |
2 |
35 |
-6 |
12 |
1 |
9 |
3 |
| NI |
3* |
3 |
– |
– |
– |
– |
15* |
-3 |
| UK |
277 |
-29 |
234 |
-24 |
110 |
+53 |
29 |
0 |
This was the system recommended by the Jenkins Commission as an alternative to FPTP in its report in 1998. It is essentially a fairly majoritarian MMP system (80-85 per cent constituencies, 15-20 per cent lists), in which the constituency seats are filled using AV rather than FPTP.
AV+ is a tricky system to model because it involves both preferential voting and non-comparable boundaries, but its properties are clear.
Single Transferable Vote (STV)
The Single Transferable Vote uses preferential voting in multi-member constituencies, unlike AV, which uses preferential voting (1, 2, 3…) in single member constituencies. Unlike AV, STV translates votes more or less proportionally into seats. Unlike other PR systems, STV involves voting for candidates rather than parties.
STV is flexible about the number of MPs per constituency – within broad guidelines constituencies can be tailored to fit the natural community areas with which people feel an identity. STV in Scottish local government uses 3-4 member seats, the Dail in Ireland has 3-5 member seats, the Maltese parliament has 5 member seats and the Northern Ireland Assembly 6 member seats.
Two projections have been made based on different sizes of STV constituency – one with seats of 3-5 members each, with a couple of exceptions for the Islands, and one with seats of 4-8 members each, with a sole 3-member seat in the north of Scotland. The differences in overall outcome and party representation are modest and depend very much on assumptions – it would be quite possible to project Labour reaching 200 under small STV, for instance, on different boundaries or slightly different assumptions. Three to five member seats are able to deliver reasonable proportionality without creating the very large constituencies that would be required under 4-8 member STV. However, ‘large’ STV lowers the barriers to entry very substantially, and may be particularly effective at encouraging smaller party and Independent candidatures and enabling a wide choice of viable candidates for voters – its dynamic effects are likely to be greater than smaller STV seats.
Model outcome of ‘small’ (3-5 member) STV, 2010
|
Con |
Change on FPTP |
Lab |
Change on FPTP |
Lib Dem |
Change on FPTP |
Others |
Change on FPTP |
| EE |
33 |
-19 |
8 |
6 |
17 |
13 |
0 |
0 |
| EM |
22 |
-9 |
14 |
-1 |
10 |
10 |
0 |
0 |
| LN |
25 |
-3 |
29 |
-9 |
19 |
12 |
0 |
0 |
| NE |
8 |
6 |
13 |
-12 |
8 |
6 |
0 |
0 |
| NW |
23 |
1 |
33 |
-14 |
19 |
13 |
0 |
0 |
| SE |
49 |
-25 |
11 |
7 |
22 |
18 |
2 |
0 |
| SW |
25 |
-11 |
6 |
2 |
24 |
9 |
0 |
0 |
| WM |
28 |
-5 |
19 |
-5 |
12 |
10 |
0 |
0 |
| YH |
21 |
2 |
18 |
-14 |
15 |
12 |
0 |
0 |
| England |
234 |
-63 |
151 |
-40 |
146 |
103 |
2 |
0 |
| Wales |
10 |
2 |
16 |
-10 |
10 |
7 |
4 |
1 |
| Scotland |
8 |
7 |
28 |
-13 |
10 |
-1 |
13 |
7 |
| NI |
2* |
2 |
– |
– |
– |
– |
16* |
-2 |
| UK |
254 |
-52 |
195 |
-63 |
166 |
+109 |
33 |
6 |
Model outcome of ‘large’ (4-8 member) STV, 2010
|
Con |
Change on FPTP |
Lab |
Change on FPTP |
Lib Dem |
Change on FPTP |
Others |
Change on FPTP |
| EE |
32 |
-20 |
12 |
10 |
14 |
10 |
0 |
0 |
| EM |
22 |
-9 |
15 |
0 |
9 |
9 |
0 |
0 |
| LN |
25 |
-3 |
28 |
-10 |
20 |
13 |
0 |
0 |
| NE |
8 |
6 |
14 |
-11 |
7 |
5 |
0 |
0 |
| NW |
25 |
3 |
33 |
-14 |
17 |
11 |
0 |
0 |
| SE |
44 |
-30 |
14 |
10 |
24 |
20 |
2 |
0 |
| SW |
26 |
-10 |
7 |
3 |
22 |
7 |
0 |
0 |
| WM |
26 |
-7 |
21 |
-3 |
11 |
9 |
1 |
1 |
| yH |
21 |
2 |
19 |
-13 |
14 |
11 |
0 |
0 |
| England |
229 |
-68 |
163 |
-28 |
138 |
95 |
3 |
1 |
| Wales |
11 |
3 |
18 |
-8 |
7 |
4 |
4 |
1 |
| Scotland |
8 |
7 |
28 |
-13 |
11 |
0 |
12 |
6 |
| NI |
2* |
2 |
– |
– |
– |
– |
16* |
-2 |
| UK |
250 |
-56 |
209 |
-49 |
156 |
+99 |
35 |
+6 |
Conclusion: The systems compared
None of these electoral systems would have produced a majority for any party on the basis of the 2010 patterns of voting (although it is possible that FPTP might have done if there were many fewer constituencies).
A point worth noting is that FPTP is the only system that would not have made it possible for a Lib Dem-Labour alliance majority government to be formed – 52 per cent of the voters supported these two parties (although it is also only reasonable to note that 59 per cent supported the Conservatives and Lib Dems between them). Under all other systems, there was more of a choice of coalition outcome than there was under FPTP. Also worth noting is that even the most extreme form of PR would represent more parties but not make governing any harder than FPTP – any combination of two of the top three parties would have a workable overall majority.
Results under reasonably proportional systems do not greatly differ in terms of overall composition of the House of Commons. This should not be surprising, as the point of PR is that the proportions of seats won should be more or less in line with the proportions of votes cast.
The biggest factors causing variation, once a system is within the broad remit of PR, are specific design features like district magnitude (how many representatives per constituency or larger electoral unit) and whether there are thresholds for representation. Smaller units (like counties) or imposing thresholds would stop smaller parties from winning most of the seats they would get under MMP or regional list PR.
The principal differences between PR systems are not in terms of the overall outcome, but in the nature of representation that they produce and the relationship between the MP and constituents. These do vary between systems – under MMP there are two categories of MP (constituency and list members), under list PR votes are cast basically for the party, and under STV votes are cast in multi-member seats for individual candidates. These features of system design are more important than small variations in modelled numbers, which are subject themselves to margins of error because of the assumptions made in the projection.
Conclusion
Conclusion
The 2010 election result, and the way the First Past the Post system worked, confirmed many of the long-term problems with British elections. Turnout, although higher than in the last two elections, was historically low, and indicated a wide gap between social classes in terms of participation in the system. Despite some improvement in numbers, women and ethnic minorities remain under-represented among MPs.
The 2010 results also showed the continuing collapse of the two party system, with the combined share for the biggest two parties (57 per cent) being the lowest ever in a British election. The underlying assumptions of FPTP, that the basic choice is between two parties and that a majority single-party government emerges with a substantial degree of public support, were falsified again by the results in 2010. The long-term trends make it more and more unlikely that FPTP will reliably produce single party majorities.
At a local and constituency level, FPTP also failed to perform. The role of MP in a single- member constituency is an increasingly prominent one, and two in three MPs obtained that position with fewer than half the votes cast. None did so with the support of a majority of electors. The results also created a political landscape of single-party strongholds and electoral deserts, where the views of substantial minorities of voters (Labour in Eastern England, the Conservatives in Scotland, and the Liberal Democrats in many English counties) had token representation or none at all.
The FPTP electoral system and the demands of voters were, once again, badly mismatched in 2010. It worked neither as its supporters wanted it to, as an efficient majoritarian system, nor in terms of producing a Parliament that resembled the British public either in its social composition or its political allegiances.