Summary
By Mihály Fazekas
The persistence of uncontested seats and one-party dominated councils at the local level is a cause for concern across England in terms of quality of public services, value for money, and government responsiveness to citizen needs. One particular high-risk area is the integrity of government contracting when controls of corruption are weak. Hence, this report investigates the impact of weak electoral accountability on corruption in public procurement, explored at the local level in England. It uses administrative data on electoral outcomes as well as on public procurement tendering procedures from 2009-2013. It employs an innovative measure of corruption risks in public procurement capturing a set of ‘red flags’ signalling the likely steering of government contracts to a favoured bidder.
Based on the comparison of matching contracts, the findings suggest that weak electoral accountability may lead to substantially higher corruption risks and lower price savings in English local councils. Councils of weak electoral accountability are roughly 50% higher corruption risk than their competitive counterparts which also coincides with foregone savings of 1-4% of contract value. The foregone savings by councils with weak electoral accountability roughly amount to 2.6 billion GBP annually. Due to incomplete data and methodological challenges, further work is needed to establish the full causal effect of weak electoral accountability on procurement corruption risks.
Thanks
The author would like to thank Elizabeth David-Barrett, Chris Terry, and Jessica Garland for their comments on earlier versions of this report. All views expressed and errors remaining are of the author only.
Weak Electoral Accountability and Corruption
Exposing the Challenge
In modern democracies one of the main pillars of good government and control of corruption is elections and electoral accountability. The change of political leadership or the risk of such change is expected to discipline holders of political power to use it for the public good rather than for their own private benefit. In addition, a strong opposition in parliaments and local councils can also increase scrutiny of the governing party through institutional checks and balances such as setting up investigative committees or using legal challenge.
Such arguments for electoral competition supporting the control of corruption are also confirmed by empirical studies from across the world. Mayors spending more time in office tend to build clientelistic networks supported by corrupt public procurement contracts, for example in Italy (Coviello & Gagliarducci, 2010) or Romania (Klasnja, 2015). Electoral campaign donations and electoral success are closely linked to favouring donating bidders in government contract awards for example in the US or Brazil (OECD, 2014).
In the UK where ‘first past the post’ electoral rules are the norm in local elections, with the exception of Scotland and Northern Ireland, lack of local accountability poses a high risk to government integrity as voters may not be able to elect an alternative to the corrupt incumbent. This suspicion in underpinned, for example, by the systematic analysis of voters’ responses to the expenses scandal of 2009 (Eggers, 2014) and by a number of concrete cases of governance weaknesses and mismanagement of public funds such as the London Borough of Newham‘s East Ham Campus project (PricewaterhouseCoopers, 2015). These prior research findings and examples point out that, while certainly not the only one, public procurement is one key government spending area where weak government accountability is likely to lead to corruption.
As public procurement is a high corruption risk of government spending in the UK, and due to the electoral system at the local level: The impact of weak electoral accountability on corruption in public procurement is explored at the local level in England. In this context weak electoral accountability at local elections is understood 1) as a borough having a large share of uncontested seats (i.e. at least 10% of seats) or 2) a council being overwhelmingly controlled by the same party for 10 years or more (i.e. same party controlling more than 2/3rd of seats without interruption). The focus is on England rather than the whole of the UK as the overwhelming majority of boroughs with many safe seats or controlled by the same party are located in England while the bulk of the public procurement data also comes from there. As the below exploration predominantly rests on quantitative analysis of large-scale administrative datasets (‘Big Data’) England proved to be the most appropriate context within the UK. Of course, this does not imply that England is the only part of the UK where weak electoral accountability may lead to corruption.
For the purposes of this report, corruption is understood in a broad sense going beyond outright bribery. In public procurement, the aim of political or high-level corruption is to steer the contract to the favoured bidder without detection recurrently in an institutionalised fashion (Fazekas & Tóth, 2014; World Bank, 2009). This is done in a number of ways, including avoiding competition (e.g., unjustified sole sourcing or direct contract awards), favouring a certain bidder by tailoring specifications, or sharing inside information. Such corruption may involve bribery and transfers of large cash amounts, but it is more typically done through broker firms, subcontracts, offshore companies, and bogus consultancy contracts to name a few typical instruments.
Data and Indicators
Data
The Electoral Reform Society collected data of local council elections between 2006 and 2014. Data on uncontested seats as well as local election results was directly collected from individual councils’ own websites by the Electoral Reform Society (Electoral Reform Society, 2011).
The public procurement data contain information on individual public procurement tenders for the whole of the UK between 2009 and 2013, including for example contract value, the deadline for submitting bids and the assessment criteria used. They derive from the European Union’s Tenders Electronic Daily, which is the mandatory online publication for every tender that falls under the remit of the EU’s Public Procurement Directive transposed into UK law. This means that large contracts are typically included in the database, with publication thresholds varying over time while being approximately 130,000 Euro for service contracts and 4,000,000 Euro for public works contracts. The database contains almost 160,000 contracts awarded for the entire period; however, I use data on only on a little over 132,000 contracts, excluding contracts below the mandatory publication threshold and those which were awarded on markets with very little spending in order to focus the analysis on high value and competitive tenders.
Indicators
For measuring weak electoral accountability at the local level all across England, we classified councils in three categories:
- One-party dominated local elections: same party controlling more than 2/3rd of the council uninterruptedly between 2006 and 2015;
- Uncontested seats: at least 10% of the local council seats are uncontested in the last local elections (Note that category 1 and 2 are not mutually exclusive, in fact 4.9% of contracts awarded by councils in these two categories are awarded by councils belonging to both categories.); and
- Competitive local elections: neither of the above.
For the exact list of councils in categories 1 and 2, see appendix A.
Measuring public procurement corruption has been long acknowledged as challenging. With the emergence of ‘Big Data’, this report can follow a novel analytical approach building on the composite indicator building methodology developed by the author, making use of a wide range of public procurement ‘red flags’ for gauging risk of procurement corruption (Charron, Dahlström, Fazekas, & Lapuente, 2015; Fazekas, Chvalkovská, Skuhrovec, Tóth, & King, 2014; Fazekas, Tóth, & King, 2013).
The measurement approach exploits the fact that for institutionalised grand corruption to work, procurement contracts have to be awarded recurrently to companies belonging to the corrupt network. This can only be achieved if legally prescribed rules of competition and openness are circumvented. By implication, it is possible to identify the input side of the corruption process, that is techniques used for limiting competition (e.g. leaving too little time for bidders to submit their bids), and also the output side of corruption, that is signs of limited competition: single bid received. By measuring the degree of unfair restriction of competition in public procurement, a proxy indicator of corruption can be obtained. This indicator, which we call the corruption risk index (CRI), represents the probability of corrupt contract award and delivery in public procurement falling between 0 and 1. Based on qualitative interviews of corruption in the public procurement process across the globe as well as a review of the literature (OECD, 2007; Pricewaterhouse Coopers, 2013; World Bank, 2009), I identified the components of CRI, that is ‘red flags’ indicating corruption risks in public procurement (Table 1).
Each of these is discussed briefly here, for more details see Fazekas et al. (2013).
- One of the most straightforward ‘red flags’ of corruption is that only a single bid is submitted. Since we are only examining competitive markets, the apparent lack of competition allows for awarding above market price contracts and extracting corrupt rents.
- A simple way to fix tenders is to avoid the publication of the call for tenders in the official public procurement journal as this would make it harder for competitors to prepare a bid. This is only considered in non-open procedures as in open procedures publication is mandatory.
- While open competition is relatively hard to avoid in some tendering procedure types such as open tender, others such as invitation tenders are by default much less competitive; hence using less open and transparent procedure types can indicate the deliberate limitation of competition, hence corruption risks.
- If the submission period, i.e. the number of days between advertising a tender and the submission deadline, is too short for preparing an adequate bid, it can serve corrupt purposes; whereby the issuer informally tells the well-connected company about the opportunity well ahead.
- Different types of evaluation criteria are prone to fiddling to different degrees. Subjective, hard-to-quantify criteria often accompany rigged assessment procedures as it creates room for discretion and limits accountability mechanisms.
- If the time used for deciding on the submitted bids is excessively short or lengthened by legal challenge, it can also signal corruption risks. Snap decisions may reflect premediated assessment, while legal challenge and the corresponding long decision period suggests outright violation of laws.
For continuous variables such as the length of submission period, thresholds had to be identified in order to reflect the non-linear character of corruption. This is because most values of continuous variables can be considered as reflections of diverse market practices, while some domains of outlier values are more associated with corruption. Thresholds were identified using regression analysis, in particular analysing residual distributions (for more on this see (Fazekas et al., 2013).
I restricted the sample to experienced issuers of tenders on competitive markets in order to minimize the chances that we are measuring honest errors or inexperience rather than corrupt practices. Thus I only examine tenders in markets with at least 10 contracts awarded throughout 2009-2013, where markets are defined by product type (CPV level 3) and location (NUTS level 1).
Table 1. Summary of Elementary Corruption Risk Indicators (Red Flags)
| Procurement Phase |
Indicator name |
Indicator values |
|
Submission
|
Call for tenders publication (non-open procedures)
|
0=call for tender published in official journal
1=NO call for tender published in official journal
|
|
Procedure type
|
0=open
1=non-open (accelerated, restricted, award without publication, negotiated, tender without competition)
|
|
Length of advertisement period
|
Number of days between the publication of call for tenders and the submission deadline
|
|
Assessment
|
Weight of non-price evaluation criteria
|
Sum of weights for evaluation criteria which are NOT related to prices
|
|
Length of decision period
|
number of days between submission deadline and announcing contract award
|
|
Outcome
|
Single bidder contract (valid/received)
|
0=more than 1 bid received
1=1 bid received
|
In addition to the identification of thresholds in continuous variables, regression analysis was used to ensure “red flags” measure corruption, and to make the indicator comparable across different sectors and countries (where different corruption techniques might be used). In this analysis, we consider “red flags” as indicating corruption only if they predict single bidder contracts. We also control for a number of likely confounders in these regressions. These controls are: (1) institutional endowments measured by type of issuer (e.g. municipal, national), (2) product market and technological specificities measured by CPV division of products procured, (3) contract size (log contract value in EUR), and (4) regulatory changes as proxied by year of contract award.
The logic of our analysis is the following: if in a certain country, not publishing the call for tenders in the official journal for open procedures is associated with a higher probability of a single bidder contract award, it is likely that avoiding the transparent and easily accessible publication of a new tender is typically used for limiting competition. This would imply that call for tenders not published in the official journal becomes part of the analysed country’s CRI. Following this logic, in addition to the outcome variable in these regressions (single bidder) only those variables and variable categories are included in CRI which are in line with a rent extraction logic and proven to be significant and powerful predictors.
Once the list of elementary corruption risk indicators is determined with the help of the above regressions, each of the variables and their categories receive a component weight. As we lack the detailed knowledge of which elementary corruption technique is a necessary or sufficient condition for corruption to occur, we assign equal weight to each variable and the sizes of regression coefficients are only used to determine the weights of categories within variables. For example, if there are four significant categories of a variable, then they would get weights 1, 0.75, 0.5, and 0.25 reflecting category ranking according to coefficient size. The component weights are normed so that the observed CRI falls between 0 and 1.
The strength of this composite indicator approach is that while individual strategies of corruption may change as the environment changes, they are likely to be replaced by other techniques. Therefore, the composite indicator is a far more robust proxy of corruption over time than a single variable approach.
Figure 1. Distribution of Contracts' CRI According to Council Type
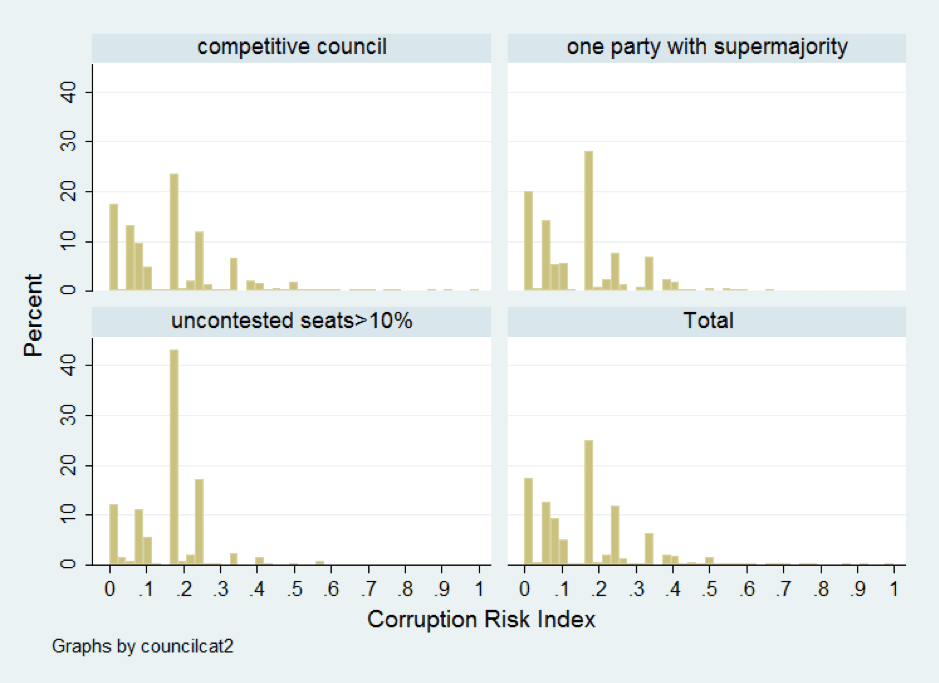 N=22,842, ENGLAND, 2009-2014 Source: TED
Findings
Findings
In the absence of true random assignment of electoral accountability characteristics to localities it is challenging to evaluate its causal impact on procurement corruption. As a second best solution, it is possible to compare similar public procurement contracts’ corruption risks (CRI) awarded by competitive councils, uncontested seats, and one-party dominated councils with competitive councils serving as a control group and the two former council types as treatment group (Imbens & Wooldridge, 2009). In such an analytical set-up, we can expect that weak electoral accountability will be associated with higher corruption risks in the public procurement tendering activity of uncontested seats as well as of one-party dominated councils compared to competitive councils. Matching is done on the level of contracts awarded in order to make sure that the composition of spending by council type (e.g. some spending more on stationery while others procuring roads) does not confound our conclusions. Matching was done using 1) year of contract award, 2) main market of the procured objects (CPV division were used as earlier); and 3) log contract value. Only contracting authorities denoted as local authority and having general public services as the main sector are considered. I used propensity score matching in stata 12.0 (The alternative Coarsed Exact Matching algorithm produced similar results albeit ones with even larger effect magnitude. I report the more conservative estimates).
Below, uncontested seats and one-party dominated councils are compared to councils of competitive local elections in turns (In order to avoid double counting those councils which are uncontested seats as well as one-party dominated councils are only included in section 3.1 and counted as uncontested seats.)
. First, the corruption risk differences are explored then the corresponding price differences as we can only be confident in corruption risks pointing at actual corruption if the corresponding prices are also higher.
Findings are only reported for English councils outside of London as London boroughs represent a special case on their own due to the two-tier government structure and London’s special economic position within all of England.
Uncontested Seats
I find that the median Corruption Risk Index (CRI) of councils denoted as safe seats compared to the rest of English councils (excluding London) is substantially higher (using medians over means is preferable due to the presence of few outlier contracts with very high CRI, comparisons using mean values are reported in appendix B with substantively the same conclusions). While raw unmatched figures don’t show any noticeable difference between groups, after matching contract characteristics, the difference becomes substantial. Uncontested seats are of roughly 50% higher corruption risk than competitive councils in the rest of England (Figure 2). In order to attach a substantive meaning to this difference, it amounts to moving from an average Swedish municipality to an average Estonian municipality in terms corruption risk performance.
Figure 2. Un-Matched and Matched Contract Samples CRI Comparisons
 Uncontested Seats Compared to Competitive Councils, 2009-2013, England Source: TED
While median values by council types are instructive of the potential effect of having a substantial amount of uncontested seats in local elections, they mask a substantial variation among individual councils (Figure 3). While clearly most uncontested seat councils have a considerably worse CRI score than the comparison group, some are very close or even better. This variation across councils highlights that other factors than electoral accountability are at play potentially mediating the effect of electoral characteristics on public procurement corruption risks.
Figure 3. CRI Distribution of Councils With Uncontested Seats and at Least 3 Contracts Awarded
And the Average English Council, 2009-2013, Source: TED
In order to gather further evidence behind the suspicion that weak electoral accountability results in higher corruption risks in government contracting at the local level, the councils’ average price savings are compared. Price savings are calculated using the ratio of originally estimated contract value and final contract value with higher savings implying that the final contract value went more below the original estimate most likely due to healthy competition among bidders.
The data, while having relatively few observations due to lots of missing value, reveals that in line with the corruption risks observed, price savings differ markedly among councils too. Uncontested seats typically achieve lower price savings: 3.4% compared to 4.4% achieved by competitive councils in England (Figure 4). While percentage values are low in absolute terms, given the annual estimated 12 billion GBP procurement done by these councils (For details of the spending estimations see the concluding section), the potential for savings for British taxpayers is large.
Figure 4. Un-Matched and Matched Contract Samples Price Savings Comparisons
Uncontested Seats Compared To Competitive Councils, 2009-2013, England, Source: TED
One-Party Dominated Councils
I find a similar relationship when looking at one-party dominance. The CRI of one-party dominated councils compared to the rest of English councils (excluding London) is substantially higher (using medians again). While raw unmatched figures show only a tiny difference between groups, after matching contract characteristics, the difference becomes substantial. One-party dominated councils are of roughly 51% higher corruption risk than competitive councils in the rest of England (Figure 5). This difference is roughly the same as the difference observed between uncontested seats and competitive councils above.
Figure 5. Un-Matched and Matched Contract Samples CRI Comparisons
One-Party Dominated And Competitive Councils Compared, 2009-2013, England, Source: TED
Once again, in order to gather further evidence for the effects of weak electoral accountability on corruption risks, the councils’ average price savings are compared. The data, while having somewhat more, but still few observations, reveals that in line with the corruption risks observed, price savings differ markedly among councils once again. One-party dominated councils typically achieve lower price savings: 2.1% compared to 6.2% achieved by competitive councils in England (Figure 6). While percentage values are low in absolute terms, given the annual estimated 41 billion GBP procurement done by these councils (For details of the spending estimations see the concluding section), the potential for savings for British taxpayers is even larger than in the case of uncontested seats.
Figure 6. Un-Matched And Matched Contract Samples Price Savings Comparisons
One-Party Dominated And Competitive Councils Compared, 2009-2013, England, Source: TED
Conclusions and Limitations
Conclusions
Based on the comparison of matching contracts, the findings suggest that weak electoral accountability may lead to substantially higher corruption risks and lower price savings in English local councils (excluding London). Councils of weak electoral accountability are roughly 50% higher corruption risk than their competitive counterparts which also coincides with foregone savings of 1-4% of contract value. While median differences between matched contracts of different council types speak of the average effect, in not every locality we find such a negative effect. Indeed, the effect is diverse, in spite of being overwhelmingly negative.
In order to help interpret the weight of the differences found, the estimated price savings are exchanged into GBP (Using the average 2013 EUR/GBP exchange rate of 0.849) and extrapolated to the total estimated public procurement market of UK local government using House of Commons figures (UK House of Commons, 2014). The very rough estimate of savings foregone in public procurement by councils with weak electoral accountability amount to 2.6 billion GBP annually which is substantial given the total 45 billion annual spending estimate (As the OECD estimates that only 24% of public procurement spending is reported in TED (OECD, 2011), an alternative estimate could be obtained amounting to 10.6 billion GBP annual savings which is most likely an overestimation.) (Table 2).
Table 2. Rough Estimates Of Potential Foregone Savings
|
total savings in database (2009-2013) |
annual savings in local UK public procurement spending |
| one party dominance |
12.6 |
2.6 |
| uncontested seat |
0.2 |
0.04 |
| total |
12.8 |
2.6 |
In Councils Of Weak Electoral Accountability Compared To Competitive Councils (Unmatched Samples), Billion GBP, Source: TED, European Central Bank, UK House of Commons
However, the results are only suggestive of the potential detrimental effects of weak electoral accountability on the control of corruption. Establishing the causal effect of local electoral competition on public procurement corruption would have required much more data. For example, better matching which could also take into account the characteristics of districts rather than the councils’ contracts only. In addition, a range of non-electoral factors may also influence corruption outcomes such as the quality and integrity of local bureaucracies, democratic accountability mechanisms other than elections (e.g. local referenda), and the wider institutional context such as the courts and audit institutions.
References
References
Charron, N., Dahlström, C., Fazekas, M., & Lapuente, V. (2015). Carriers, connections, and corruption risks in Europe (No. 2015:6). Quality of Government Institute, University of Gothenburg.
Coviello, D., & Gagliarducci, S. (2010). Building Political Collusion: Evidence from Procurement Auctions (No. 4939). IZA DP No. 4939, Bonn: Institute for the Study of Labor (IZA).
Eggers, A. C. (2014). Partisanship and Electoral Accountability: Evidence from the UK Expenses Scandal. Quarterly Journal of Political Science, 9(4), 441–472. doi:10.1561/100.00013140
Electoral Reform Society. (2011). English local elections. London.
Fazekas, M., Chvalkovská, J., Skuhrovec, J., Tóth, I. J., & King, L. P. (2014). Are EU funds a corruption risk? The impact of EU funds on grand corruption in Central and Eastern Europe. In A. Mungiu-Pippidi (Ed.), The Anticorruption Frontline. The ANTICORRP Project, vol. 2. (pp. 68–89). Berlin: Barbara Budrich Publishers.
Fazekas, M., & Tóth, I. J. (2014). New ways to measure institutionalised grand corruption in public procurement (No. 2014:9). U4 Anti-Corruption Resource Centre, Bergen, Norway.
Fazekas, M., Tóth, I. J., & King, L. P. (2013). Anatomy of grand corruption: A composite corruption risk index based on objective data (No. CRCB-WP/2013:02). Budapest: Corruption Research Center Budapest.
Imbens, G. W., & Wooldridge, J. M. (2009). Recent Developments in the Econometrics of Program Evaluation. Journal of Economic Literature, 47(1), 5–86.
Klasnja, M. (2015). Corruption and the Incumbency Disadvantage: Theory and Evidence. Journal of Politics, forthcoming.
OECD. (2007). Integrity in Public Procurement. Good Practice from A to Z. Paris: OECD.
OECD. (2011). Government at a Glance 2011. Paris: OECD.
OECD. (2014). Financing Democracy. Supporting Better Public Policies and Preventing Policy Capture. Paris: OECD.
Pricewaterhouse Coopers. (2013). Identifying and reducing corruption in public procurement in the EU. Brussels: PricewaterhouseCoopers and Ecorys.
PricewaterhouseCoopers. (2015). London Borough of Newham Report in the Public Interest Audit of Accounts 2013/14 and 2014/15. London.
UK House of Commons. (2014). Local government procurement. Sixth Report of Session 2013–14. London: UK House of Commons.
World Bank. (2009). Fraud and Corruption. Awareness Handbook. Washington DC: World Bank.
Appendix A
Table 3. List of Councils Denoted as Uncontested Seats
| Council |
| Eden |
| East Dorset |
| South Northamptonshire |
| Waverley |
| North Kesteven |
| Ryedale |
| Wychavon |
| Rochford |
| Hambleton |
| Malvern Hills |
| St Edmundsbury |
| Rutland |
| Tewkesbury |
| Derbyshire Dales |
| South Kesteven |
| East Devon |
| Maldon |
| West Devon |
| Allerdale |
| Richmondshire |
| East Hampshire |
| Lichfield |
| East Northamptonshire |
| Ribble Valley |
Table 4. List of Councils Denoted as One-Party Dominated
| Councils |
| Adur |
East Hampshire |
Maldon |
St. Edmundsbury |
| Arun |
East Hertfordshire |
Manchester |
Stevenage |
| Barking & Dagenham |
East Northamptonshire |
New Forest |
Suffolk Coastal |
| Bexley |
East Riding of Yorkshire |
Newham |
Sunderland |
| Bolsover |
Eastleigh |
Nottingham |
Surrey Heath |
| Bournemouth |
Fenland |
Oadby & Wigston |
Tameside |
| Bracknell Forest |
Forest Heath |
Ribble Valley |
Tandridge |
| Braintree |
Gateshead |
Rochford |
Test Valley |
| Breckland |
Greenwich |
Rotherham |
Tonbridge & Malling |
| Bromley |
Hackney |
Runnymede |
Tunbridge Wells |
| Broxbourne |
Hambleton |
Salford |
Wandsworth |
| Buckinghamshire |
Havant |
Sandwell |
Waverley |
| Central Bedfordshire |
Hertsmere |
Sevenoaks |
Wealden |
| Cherwell |
Horsham |
Shepway |
Wellingborough |
| Chichester |
Huntingdonshire |
South Bucks |
West Berkshire |
| Chiltern |
Kensington & Chelsea |
South Hams |
West Oxfordshire |
| Christchurch |
Knowsley |
South Norfolk |
Westminster |
| Dacorum |
Lambeth |
South Northamptonshire |
Windsor & Maidenhead |
| Daventry |
Leicester |
South Staffordshire |
Wokingham |
| East Dorset |
Lichfield |
Spelthorne |
Wychavon |
Appendix B - Comparisons Using Average CRI Values
Table 5. Uncontested Seats Compared To Competitive Councils
| mean CRI |
|
raw comparison |
matched samples |
| rest of English local councils |
0.153 |
0.125 |
| uncontested seats |
0.158 |
0.158 |
Un-Matched and Matched Contract Samples CRI Comparisons, 2009-2013, England
Table 6. One-Party Dominated and Competitive Councils Compared
| mean CRI |
| |
raw comparison |
matched samples |
| rest of English local councils |
0.152 |
0.155 |
| one-party dominated councils |
0.154 |
0.154 |
Un-Matched and Matched Contract Samples CRI Comparisons, 2009-2013, England